From SCDigest's On-Target E-Magazine
- Aug. 20, 2014 -
Logistics News: Q2 2014 Rail Carrier Review
With Q1 Weather Woes Behind them, US Rail Carriers See Revenue and Profits Soar Even as Rate Hikes Moderate
SCDigest Editorial Staff
US rail carriers enjoyed something of a blow out Q2, with solid revenue gains based on generally strong carload volumes, even as pricing power continues to wane.
SCDigest Says: |
 |
| Union Pacific's operating ratio of 63.5% was an all-time quarterly record, 2.2 points better than the second quarter 2013 and 1.3 points better than the previous all-time quarterly record set in the third quarter 2013. |
|
What Do You Say?
|
|
|
|
We're back as usual every quarter with our review of the results and comments from leading public rail carriers, as the last of them finished up their Q2 2014 earnings reports in the last few weeks.
Last week, we covered the US truckload sector (see Q2 2014 Truckload Carrier Review and Comment).
Here we look at the four major Class I public carriers that make up the US rail sector (Burlington Northern is of course part of public company Berkshire Hathaway, but its results are not broken out in any detail and thus are not included)
Shortly, we'll have the same analysis for the less-than-truckload (LTL) sector.
The quarter and first half of the year saw generally strong volume gains, according to the Association of American Railroads.
Through the first six months of the year, total rail carload traffic was up 4.5%, according to AAR data, led by intermodal car growth of 5.9%, as shown in the graphic below.
Based on data from the rail carriers, it appears Q2 produced even more positive numbers.
1H 2014 Rail Car Growth
Source: Association of American Railroads
As shown in the table below, revenue for the group was up a solid 8.8%, on carload growth that averaged between 7 and 8%.
Kansas City Southern and Union Pacific led the way, with revenue growth of 12.2% and 9.9%, respectively.
Profits were also strong, up 19.2% versus Q2 in 2013, and net income as a percent of revenue rose to a very strong 19.2%. It wasn't that long time ago that railroads were a very challenged industry in terms of profits. Union Pacific was able to achieve operating income as a percent of revenue of 22.8%, a number that would stand up in almost every sector.
| For Second Quarter Ending June 30, 2014 |
|
Data in $Thousands |
|
|
|
|
|
|
| Carrier |
Total Operating Rev Including Fuel |
Change 2013 to 2014 |
Total Volume Growth (Revenue Carloads) |
Volume Growth General Merchandise, Auto, Ag., etc.* |
Volume Growth Coal |
Volume Growth Intermodal |
Net Income |
Change 2013 to 2014 |
Net Income as % of Revenue |
Net Income as % of Revenue 2013 |
Operating Ratio |
Operating Ratio 2013 |
| Union Pacific |
$5,661,000 |
9.9% |
8.0% |
8.0% |
1.0% |
12.0% |
$1,291,000 |
16.7% |
22.8% |
21.5% |
63.5% |
65.7% |
| CSX |
$3,244,000 |
6.5% |
8.0% |
8.0% |
6.0% |
7.0% |
$529,000 |
1.5% |
16.3% |
17.1% |
69.3% |
69.1% |
| Norfolk Southern |
$3,042,000 |
8.6% |
7.8% |
6.6% |
2.6% |
10.1% |
$562,000 |
20.9% |
18.5% |
16.6% |
66.5% |
70.1% |
| Kansas City Southern |
$649,700 |
12.2% |
7.0% |
NA |
1.0% |
7.0% |
$130,200 |
729.3% |
20.0% |
2.7% |
68.3% |
69.0% |
| Total Carriers |
$12,596,700 |
8.8% |
|
|
|
|
$2,512,200 |
19.2% |
19.9% |
18.2% |
66.9% |
68.5% |
| * KCS Southern moves almost exclusively bulk commodities and materials |
|
|
|
|
|
|
|
|
There was general improvement in the carriers' operating ratios, or operating expense divided by operating revenue, a key metric in the transport sector. Here again Union Pacific led the way, driving its OR down to a record 63.5%. Norfolk Southern also had strong OR performance in Q2, driving its number down to just 66.5% from 70.1% in Q2 2013.
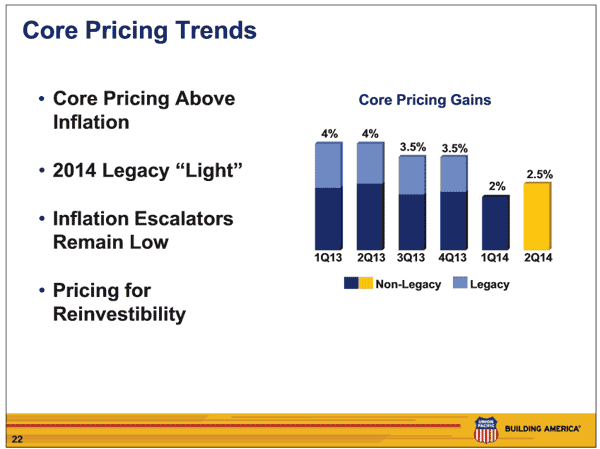
All that even as pricing power by the rail carriers seems to have waned a bit in recent quarters. A few years ago, pricing gains in the 5% range were commonly cited. In 2013, that dropped to more like 4%, and in the past two quarters core pricing gains have been more in the 2% range - but that didn't stop the profit machine in Q2.
(Transportation Management Article Continued Below)
|