From SCDigest's On-Target E-Magazine
- Aug. 28, 2013 -
Supply Chain News: Interesting Predictions on How US Freight Market Will Play Out over Next 12 Years
Latest ATA Freight Tonnage Forecast Provides Interesting Picture of Current US Transportation Patterns, Predictions for 2024
SCDigest Editorial Staff
The American Trucking Associations is out with another of its US freight forecast reports, this time through 2024, and as always it contains a lot of very interesting facts and predictions.
First, we summarized some of the basics facts about the US transport sector, as compiled by ATA chief economist Bob Costello, who had help from IHS Global Insights and Martin Labbe Associates. SCDigest notes that this data is also used heavily in CSCMP’s annual State of Logistic Report each year.
SCDigest Says: |
 |
| That GDP trend then drives estimates for tonnage growth, which the report says will average 2.4% per year from 2013 to 2018, and then taper sharply to just 0.8% during the six years through 2024. |
|
What Do You Say?
|
|
|
|
Of course, the state of US freight is tightly correlated with changes in the US economy and GDP, and as with US manufacturing output, freight volumes, though much improved from the lows of the Great Recession, have yet to recover back to pre-recession highs.
For example, total freight tonnage was still off 12% in 2012 from 2006 levels, though up 8.2% from the low in 2009. Also in 2012, truck tonnage was up 10.3% from the low in 2009, but still off 12.7 % from the high in 2006. However, we will note that in May and June of this year, the ATA Truck Freight Tonnage Index did reach record highs.
We will also note that US manufacturing output obviously has a large impact on transport volumes, and is still more than 4% below its record highs in 2007,
Additionally, among the insights from the ATA report:
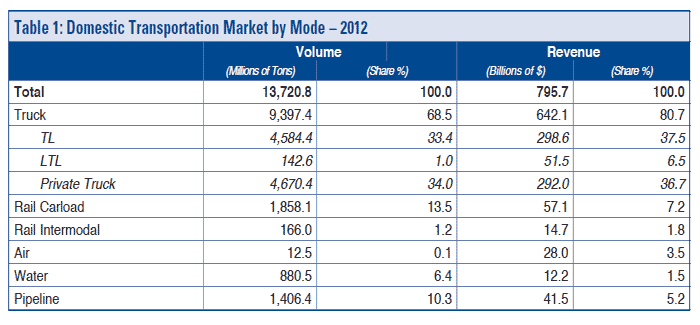
Of total US tonnage, a surprising 61.6% is of the bulk variety (e.g., coal, oil, agricultural products). Just 38.4% is "general freight."
• Trucks handled an estimated 63.3% of total tonnage in 1990, 68.6% in and 68.5% in 2012.
• Truckload tonnage was estimated at 4.58 billion tons in 2012; up 2% and accounting for 33.4% of total freight tonnage and 48.8% of truck tonnage. Truckload revenue was estimated at $298.6 billion in 2012, an increase of 7.0% over 2011 (implying overall rate increases of about 5%). This translates into 37.5% of total transportation revenues and 46.5% of overall truck revenue (the report also calculates the spend of private fleets).
• Surprisingly, LTL (which in this data includes the parcel operations of UPS and FedEx in additional traditional LTL carriers) accounts for only about 1% of total domestic freight tonnage and 1.5% of total truck tonnage. But, because LTL costs more per pound of freight, it accounted for 6.5% of total US transportation revenue and 8.0% of truck revenue.
• Private trucking firms handled an estimated 4.67 billion tons of cargo in 2012, an increase of 1.9%, representing 34.0% of total freight tonnage and 49.7% of truck tonnage.
A summary of US freight tonnage last year by mode and general versus bulk freight is shown below.

Source: US Freight Transportation Forecast to 2024, ATA
Economy will be Key to Tonnage Changes
As noted above, economic activity is the key to changing freight tonnage and transportation spend, and here the ATA is modestly optimistic over the next decade.
(Transportation Management Article Continued Below)
|