From SCDigest's On-Target E-Magazine
- May 15, 2013 -
Logistics News: Q1 2013 Truckload Carrier Review
Profits Generally Soar on Modest Volume Growth; Evolution at JB Hunt Continues On
SCDigest Editorial Staff
We're back as usual every quarter with our review of the results and comments from leading public truckload carriers, as the last of them finished up their earnings reports in the last two weeks.
SCDigest Says: |
 |
| Profits for the group overall were strong, with net income up 20% in the quarter, or almost four times the level of revenue growth. |
|
What Do You Say?
|
|
|
|
After this week's exclusive review of the truckload sector, next week we will present similar data and analysis for less-than-truckload carriers and the four major public rail carriers.
For three of the four quarters we provide results for both the just closed quarter as well as year-to-date numbers, but as nearly all carriers operate on a calendar year basis, after Q1 the quarter and year-to-date are obviously the same, so the latter is unneeded.
The story in Q1 from SCDigest's vantage was profitability. In general, carriers saw profits soar versus load and revenue growth. In total, the ATA's Truck Tonnage Index was up 3.9% versus 2012 at the end of Q1, though the Cass Freight Index has been showing slower growth that that.
Regardless, as TL carriers continue to maintain strong asset discipline, with that trend in some cases reinforced by trouble hiring drivers, the net result is that total capacity in the sector is growing slowly as best, allowing the carriers some pricing power and the change to optimize their networks and customer bases.
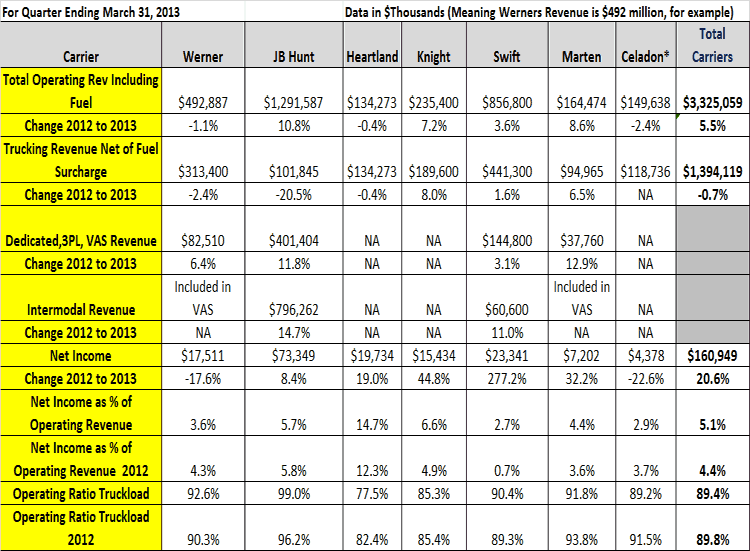
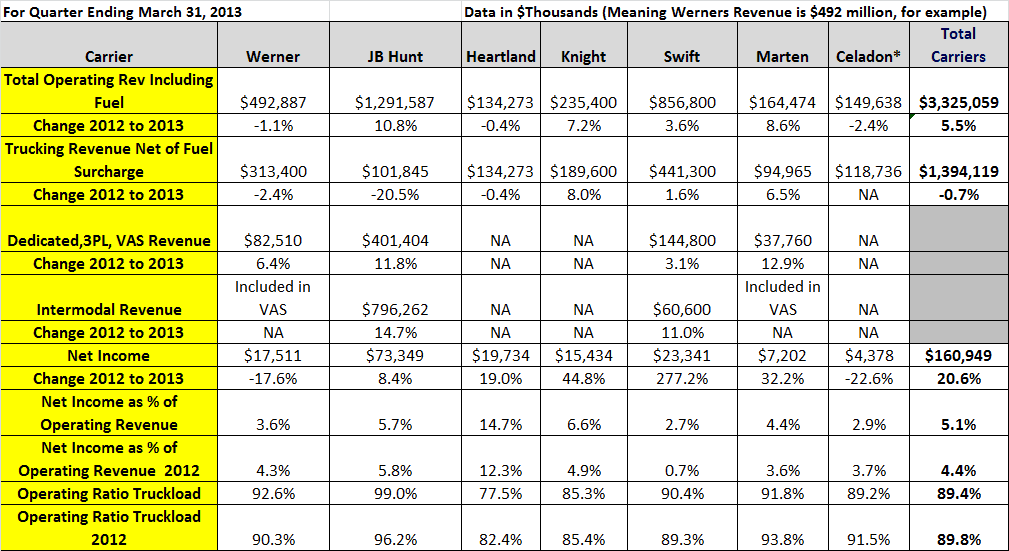
All told, carrier revenues for the quarter were up 5.5% in Q1 versus last year, as shown in the table below. But that includes fuel service revenue, and as best we can calculate diesel costs and surcharge revenues per mile should have been about flat year over year. Average on-the-road diesel prices were about $4.02 in Q1, versus $3.97 in Q1 2012, or up about 1%.
Confounding any analysis is the way carriers handle revenue and profits by segment. Different carriers handle reporting for intermodal, dedicated, 3PL, brokerage and other such non-core truckload carriage differently, so a true apples-to-apples comparison across carriers is often not possible. There is also a great deal of difference in the percent of business different carriers have in those segments. In general, carriers listed in the table with NA (not applicable) in a segment revenue row do not have much if any business in that area, or have combined that revenue into a single non-core trucking category. Conversely, carriers such as JB Hunt or Swift Transportation provide detailed numbers by segment.
So there is no question what is happening at JB Hunt, as the core trucking business that of course started the company and led it to the top of the industry is becoming almost an afterthought.
Q1 2013 Truckload Sector Results
See Larger Image
Revenue in the segment for Hunt fell another 20.5% in the quarter, down to about $101 million, or just 8% of total operating revenue, down from 11% in Q1 2012, as this number continues to fall. The operating ratio in the trucking segment was just 99%, meaning the segment operated just barely above breakeven, and the segment's meager profits represented just 1% of total operating profits, as the segment continues to shed trucks as well.
Trucking-only revenue in fact fell just under 1% in the quarter across the whole group, whereas total revenues (including fuel surcharge) were up as noted above 5.5%. This indicates a combination of a focus on non-core trucking by Hunt, Werner, and Swift, and some modest pricing power/rate increases in the quarter across the group.
Profits for the group overall were strong, with net income up 20% in the quarter, or almost four times the level of revenue growth.
Swift, Knight, Marten and Heartland saw profits up 277%, 44.8%, 32.2%, and 19% respectively in Q1 over 2012.
The average unweighted operating ratio across the group fell .4 percentage points to 89.4%, though Heartland again blew away the field, with an OR of just 77.5% in Q1, a decline of about 5 percentage points. That is impressive.
Several carriers warned that if the Federal Appeals Court does not throw out the new Hours of Service rules schedule now to go into effect July 1, productivity in the industry will be lost, and shippers need to understand the potential impact.
"If these rules are adopted, and our customers are unable to provide more flexibility in terms of pickup and delivery times, it will have a negative effect on productivity and available capacity," Knight noted in its earnings release. "We have and will continue to work closely with our customers to help them understand the practical impacts of these changes to driver available hours, and to understand how driver available hours constrains capacity and affects the cost of our services."
(Transportation Management Article Continued Below)
|

