From SCDigest's On-Target E-Magazine
Dec. 7 , 2011
Logistics News: Rail Carrier Profit Engines Roll On, While LTL Sector Slowly Crawling Out of Its Hole
Public Rail Carriers Show Profit Growth Well Above Changes in Volumes; LTL Carriers are Slowly Turning the Financial Ship Around On Rate Increases, Business Discipline
SCDigest Editorial Staff
Warren Buffet certainly seemed to know what he was doing when he took rail carrier Burlington Northern private two years ago, as our analysis of Q3 financial performance for the sector shows the remaining four public rail carriers continuing to enjoying robust levels of profits.
SCDigest Says: |
 |
| The once not very profitable rail sector now finds itself with operating ratios (operating costs as a percent of operating revenues) of 70% or lower - meaning margins are fat |
|
What Do You Say?
|
|
|
|
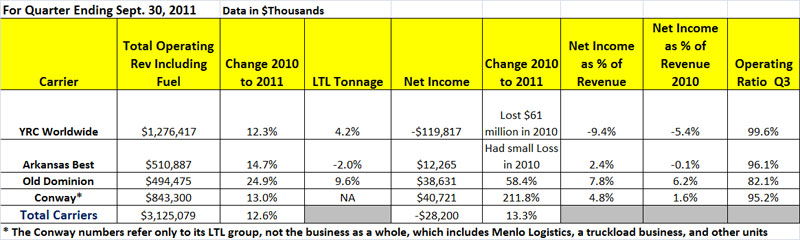
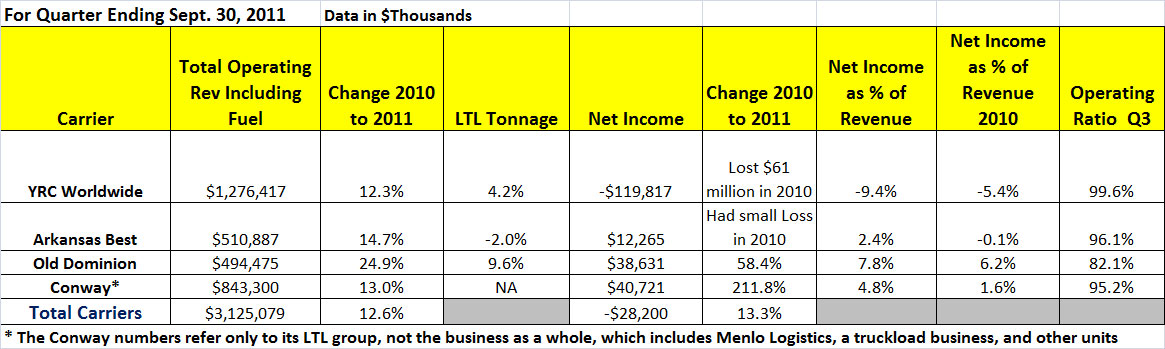
Meanwhile, the beleagured less-than-truckload (LTL) sector showed real financial improvement in the third quarter, with some of them actually showing a profit for a change - including Old Dominion, of course, which continues to show dramatically better financial performance than its competitors.
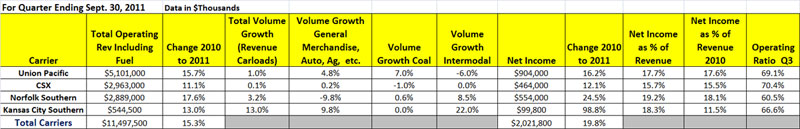
As shown in the graphic below, the four large US public rail carriers (Union Pacific, CSX, Norfolk Southern, and Kansas City Southern) saw revenues in Q3 rise in aggregate more than 15% - while volume growth was mostly low.
Union Pacific and CSX saw basically flat rail car loadings in the quarter, and Norfolk Southern saw loadings up a modest 3.2%. Only Kansas City Southern saw a real spike, with loadings up 13% in Q3, driven by a big 22% spike in its intermodal business.
These revenue gains were driven in part by increases in rail surcharge revenues, which were up about 5% for most of the carriers, with a couple of them saying they were able to do a better job in Q3 of recovering their cost of fuel than in previous quarters.
But net of fuel surcharges, clearly price and other "mix" factors were involved given that revenue and profit jumped so much above the levek of increase in volumes.
Net income in the sector for the quarter ws up a very strong 19% in aggregate, led by Kansas City Southern's 98% gain. Increases in net income for UP, CSX and NS were up 16%, 12% and 24.5% respectively,
This once not very profitable sector now finds itself with operating ratios (operating costs as a percent of operating revenues) of 70% or lower - meaning margins are fat. Compare that with the truckload carrier sector, which even in this most recent strong quarter had most carrierswith operating ratios in the low to mid-80% range.
As shown below, LTL carriers of late have had trouble getting below the 100% level, above which operating expense are greater than revenues, and LTL carriers are now feeling much better good when operating ratios jst get top the mid-90% range.
Q3 2011 Rail Carrier Performance
Source: SCDigest Analysis
For a larger image of ths chart, click here: Q3 2011 Rail Carrier Financial Performance.
In terms of rail pricing trends, the chart below from Union Pacific really tells the story.
Union Pacific Rate Trends
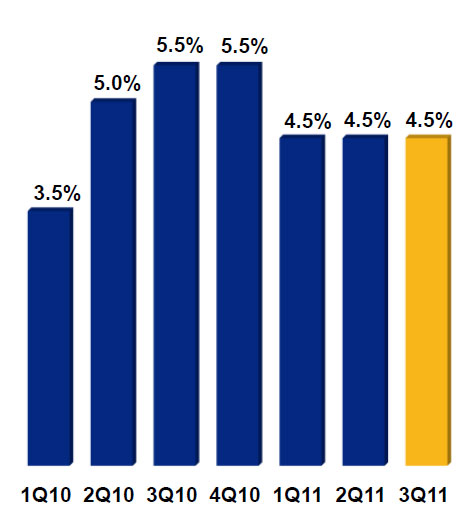
As the chart shows, UP has enjoyed year-over-year rate increases of more than 5% in every quarter since Q2 of 2010, with another 4.5% in Q3 even as its demand (car loadings) was flat for the quarter. In UP's intermodal segment, loadings were actually down 6% in the quarter, while revenue per carload was up 8%.
Other carriers noted similar pricing trends.
(Transportation Management Article Continued Below)
|

