From SCDigest's On-Target E-Magazine
July 27, 2011
Supply Chain News: Inventory Performance by Industry 2005 to 2010
Days Inventory Outstanding Numbers not Very Good over Past Six Years; Real Progress Seen in Restaurant Chains, Multi-Line Retail and Chemical Companies
SCDigest Editorial Staff
Last week, SCDigest editor Dan Gilmore again analyzed the annual working capital scorecard data from Hackett Group/REL, focusing as always on the Days Inventory Outstanding (DIO) component of corporate working capital performance (the other two are Days Sales Outstanding (how fast a company gets paid by its customers) and Days Payable Outstanding (how fast - or slow - a companies pays its suppliers). See Inventory Performance 2011.
SCDigest Says: |
 |
Restaurant chains, multi-line retail chains,and chemical companies seemed to make true and consitent progress in reducing inventory levels over the six-year analysis horizon. |
|
What Do You Say?
|
|
|
|
In that column, we primarily focused on changes in DIO from 2009 to 2010 (the REL data for 2011 is based on 2010 fiscal year financial reporting for public companies. As noted in Gilmore's column, this year SCDigest did some work to make the industry sectors a bit more consistent from how most would look at supply chain data, and also for the first time used average DIO to assess performance in each industry sector, rather than the median totals REL reports.
The REL study defines Days Inventory Outstanding as hoiw many days of sales the company is holding in inventory, and which it defines as:
End of Year Inventory Level/[total revenue/365]
As such, it is sort of the reverse of inventory turns, in that a higher DIO, all things being equal, means poorer inventory management performance, while a lower number signals improvement.
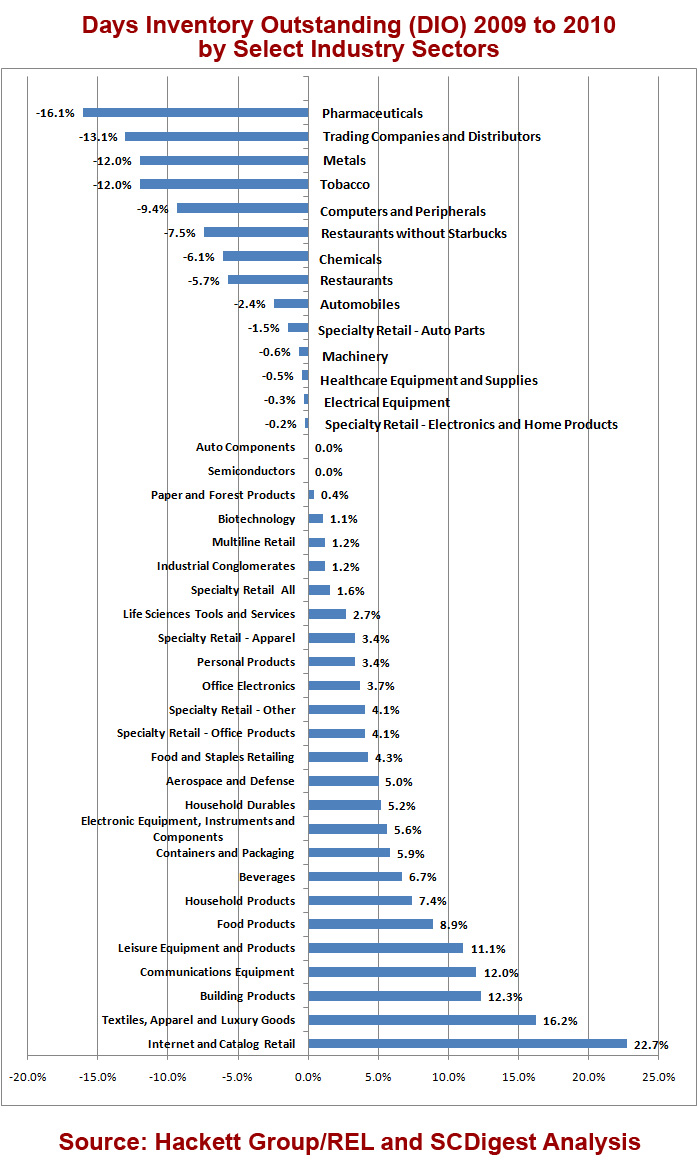
We published a graphic showing the year over year changes in DIO across some three dozen industries, which readers can find here: 2010 Days Inventory Outstanding Performance. We will note there a couple of changes in this chart versus the original data due to some spreadsheet errors on our part, now corrected. The changes can be found in the following sectors: Communications Equipment, Catalog and Internet Retailers, and Restaurants.
We took that analysis a step further this week, and looked at DIO performance across these same sectors from 2005 through 2010, the scope of the REL data.
The results are very interesting, and are displayed in the graphic below.It lists each sector we analyzed, the number of companies in the sector, example companies in the group (or all companies if four or less in the sector), the companies with the lowest and highest DIO figures for 2010, average DIO totals for 2005 to 2010 for each sector (in reverse order), and finally the change for the sector from 2005 to 2010.
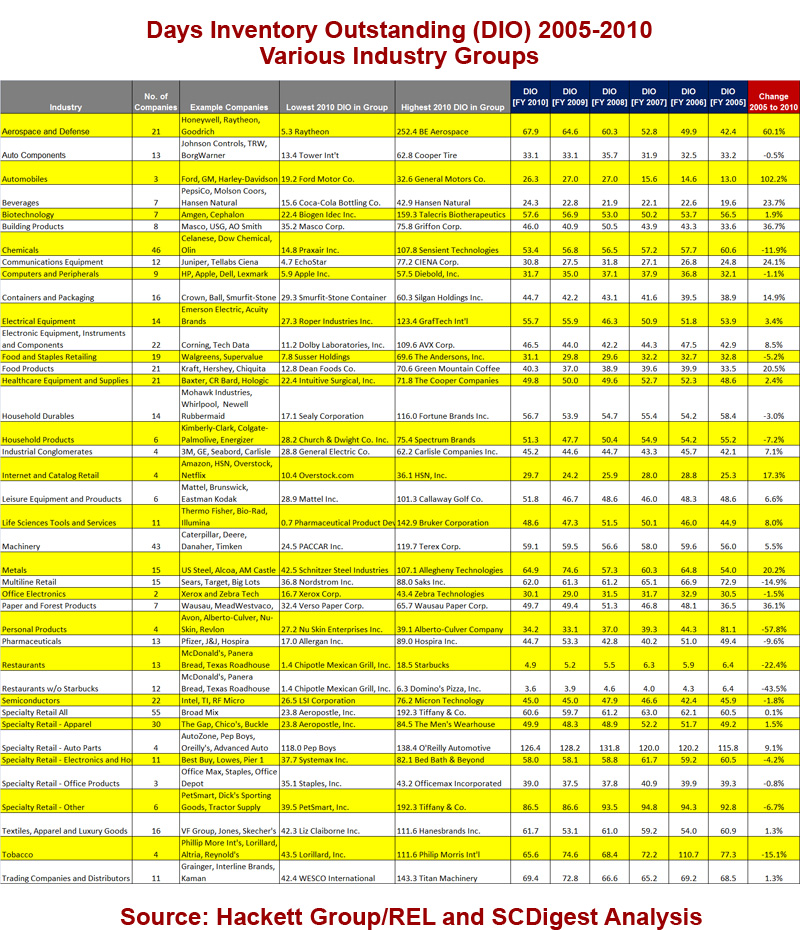
This graphic is also available here as a pdf document.
(Supply Chain Trends Story Continued Below) |

