From SCDigest's On-Target e-Magazine
Feb. 9, 2011
Supply Chain News: When it Comes to Calculating Procurement Savings, Many Roads to the Same Goal
New Data from CAPS Research Shows Wide Variation Among Companies to Measure Sourcing Savings; 4.26% as Percent of Total Spend Saved through Procurement Actions on Average
SCDigest Editorial Staff
There is only one clear insight from the latest data from CAPS Research on procurement savings measurement - there are about as many answers as there are companies.
CAPS Research is an arm of the Institute for Supply Management (of the Purchasing Managers Index fame), which in turn is a arm of Arizona State University. CAPS periodically releases benchmark and topical research on procurement/purchasing subjects.
SCDigest Says: |
 |
| The diversity in terms of how companies manage this process is evident, starting with who drives setting the financial targets for procurement savings. |
|
What Do You Say?
|
|
|
|
In January, CAPS released a new benchmark report on corporate approaches to measuring savings from procurement. That was based on survey responses from 78 mostly large companies across a variety of industry sectors from across the globe. Respondents ranged from 3M (industrial conglomerate) to General Mills (consumer package goods) to IBM (high tech), Warner Brothers (entertainment), and PriceWaterhouseCoopers (professional services). That diversity is important, because non-manufacturing companies obviously have little or no "direct spend" as part of the purchasing mission, somewhat confounding the data.
That said, respondents on average reported that the procurement organization controlled or managed 83% of direct materials spending (including a low of 0%, presumably from one or more non-manufacturing companies), 70% of non-direct spend, and 67% of capital goods spending.
Nearly all respondents (95%) attempt to measure "cost reduction" savings from procurement activities. A somewhat smaller percentage (70%) attempt to measure the even more challenging area of "cost avoidance." In total, respondents on average said that they were able to connect reductions 4.26% of total spend to the efforts of the procurement organization. The range was wide, however, with just .18% savings on the low end to about 19% on the high end. The median (half above and below) was lower than the average, at just 2.85%.
The survey found 40% of companies review their progress against targeted cost savings from procurement monthly, 13.5% quarterly, and 25.4% annually.
About 20% of companies account for all savings from a multi-year contract in the first year, versus the 43% that apportion those savings each year across the contract. Many companies use other methods, and many use multiple approaches.
The diversity in terms of how companies manage this process is evident, starting with who drives setting the financial targets for procurement savings. 35 different distinct titles were cited by the group, and the most common title, Chief Procurement Officer, was listed by just nine of the 78 companies. Chief Financial Officer was the next most popular, at five responses. Others cited included VP of Operations, VP Shared Services, VP of Sourcing, Head of Logistics Services and more, though in reality a number of the titles provided were close enough to each other that they could well have been combined.
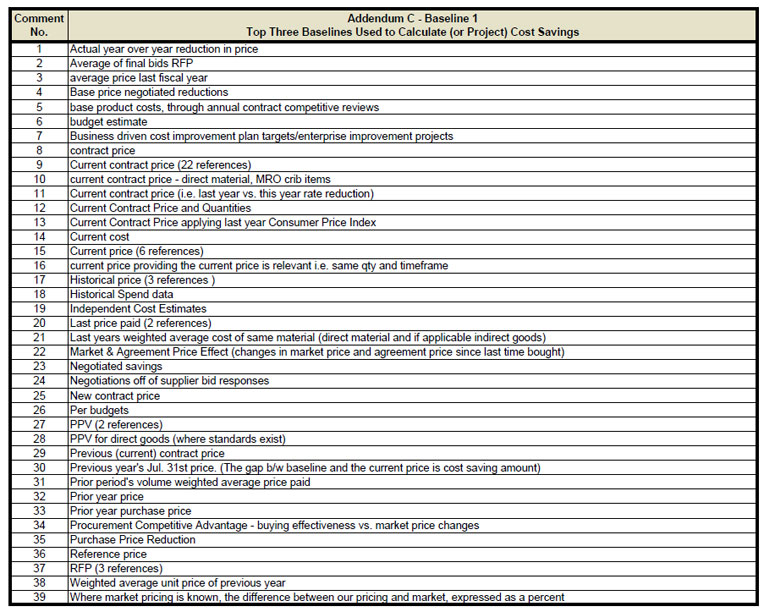
The diversity of approaches was even more clear on answers to a question about the "methods of setting savings targets," for which as shown in the figure below elicited a wide range of responses. The figure represents just about half of the total responses, which showed similar variation.
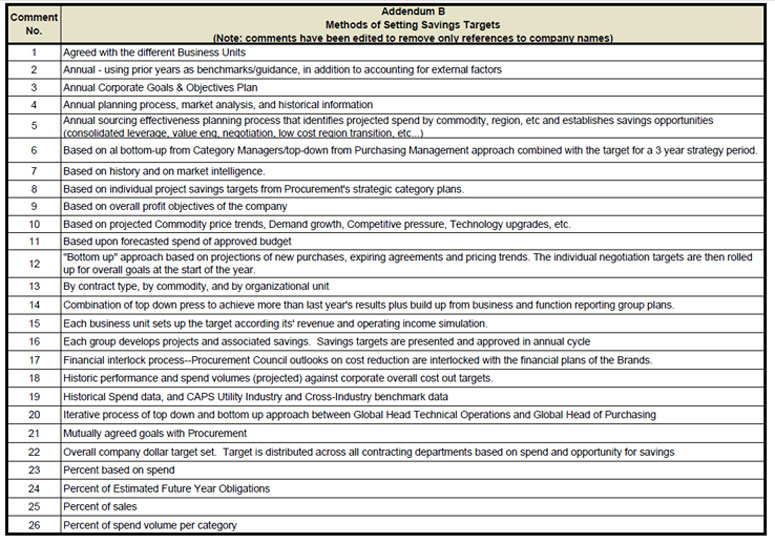
Source: CAPS Research
(Sourcing and Procurement Article Continues Below)
|