From SCDigest's On-Target E-Magazine
Feb. 1, 2011
Logistics News: Q4, All of 2010 Much Better for Truckload Carriers, but Data Show Divergent Performance
Revenues Rise Nicely, but Profits Even More; What is Up with the Money Machine at Heartland Express?
SCDigest Editorial Staff
With a modest economic recovery in 2010 and freight volumes showing definite but also improvement, US truckload carriers turned in strong financial improvement across the board in the fourth quarter and for the full year 2010, but the level of improvement varied widely across the sector.
Fourth quarter and full year 2010 (unaudited) financial results started filtering in last week and are continuing this week, and overall the news is quite good for the carriers and their shareholders, based on an SCDigest analysis of results from eight of the largest publicly trade TL carriers.
As shown in the table below, Q4 was largely a good one for all the carriers, though as with the full year 2010 results this was in part the easy comparisons to the disastrous results that characterized all of 2009, a period that was legitimately called a "freight depression."
SCDigest Says: |
 |
| In the end though, it all this meant good news for the carrier bottom lines, with profits up in Q4 in the 20-45% range for a number of them.. |
|
What Do You Say?
|
|
|
|
Before looking at those results, which should be of interest to shippers in terms both of how individual carriers are performing financially and shedding light on the different strategies of each carrier, it is important to note that each company reports their results somewhat differently.
While the total revenue and net income numbers are standard across all of them, the reporting of "segment revenue" differs markedly. Some, such as like JB Hunt, offer detailed analysis by lines of business such as trucking, dedicated, intermodal, etc., while most others simply lump all non-straight trucking revenue under "logistics" or 3PL revenue, if broken out at all. SCDigest put the non-trucking revenue in whatever category seemed to make the most sense for a given carrier.
Total revenues were up across the board, but with a pretty wide range. JB Hunt led the way on the top end, seeing 16% Q4 growth, while Celadon saw sales growth (including fuel surcharges) of just 4.6%. By point of reference, the American Trucking Associations Freight Index was up .8% in October, down .6% in November, and up 2.2% in December, meaning freight volumes in total were up just a couple of percent for the quarter.
But a slightly different tale emerges when looking at trucking revenues net of fuel surcharges. Here, the numbers in general show much lower growth than overall revenues. That is a reflection of the fact that diesel prices soared in Q4, and that for some carriers (e.g., JB Hunt, Marten) non-trucking revenues are growing much faster than traditional TL services.
In the end though, it all this meant good news for the carrier bottom lines, with profits up in Q4 in the 20-45% range for a number of them. Swift, however, continues to be an outlier, with the country's largest carrier by truckload volume showing a Q4 loss of $48 million dollars, though that was down 86.5% from Q4 2009.
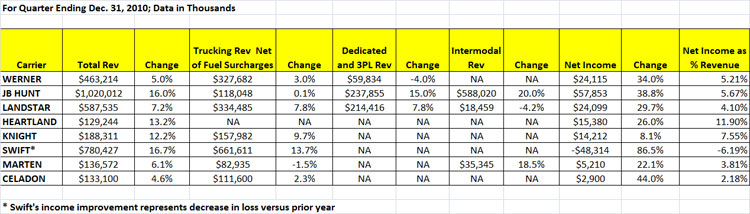
Source: SCDigest Analysis
Full Year Results Also Strong
Results were similar for the full fiscal year 2010, as shown in the graphic below.
The most obvious metric is that total profitability (net income) was up dramatically versus the rise in revenue. That shows how highly leveraged the asset-intensive carrier market is, where pushing revenues above the break-even mark can lead to substantial increases in total profits.
An interesting story continues to be the excellent profitability of Heartland Express, which is saw net income on sales revenue of 11.9% for the quarter and 12.4% for the full year - amazing numbers for the generally low profit trucking industry.
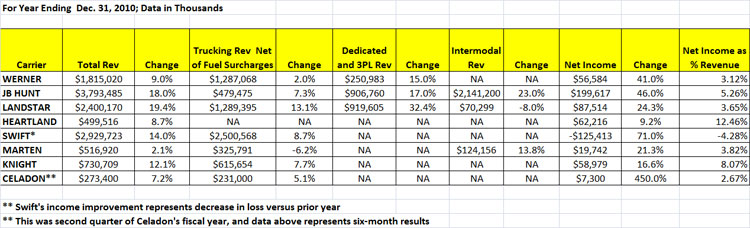
Source: SCDigest Analysis
Below, we offer some highlights of the carrier earnings reports that offer insights into the market as a whole and individual carrier success and strategies.
Werner
"Our average revenues per total mile increased 4.2% in fourth quarter 2010 compared to fourth quarter 2009 due to rising contractual pricing, higher spot market rates and a lower average percentage of empty miles. Sequentially from third quarter 2010 to fourth quarter 2010, average revenues per total mile increased slightly, because few customer contracts were eligible for renewal during fourth quarter 2010.
(Transportation Management Article Continued Below)
|

