Supply Chain Comment
September 13, 2011
By Arnold Mark Wells, CPIM and Michael W. Okey
Supply Chain Comment: Finding the Value in Your Value Network
Combining Six-sigma Tools with an Approach for Guiding Priorities in Process Improvement Can Deliver Powerful Results
What is the ultimate goal of supply chain planning and execution? In pondering that question, consider the following:
Wells and Okey Say: |
 |
| The PSV Matrix relates business decision processes to symptoms, ultimately allowing us to link potential root causes within each decision process to undesirable business symptoms. |
|
What Do You Say?
|
|
|
|
You face more tasks than you can accomplish. Some activities are so critical that operations falter, customers complain, and senior management reacts if you do not perform them well. You form a crucial link in a network of processes and activities involving colleagues, vendors, customers, and partners. Smart planning and flawless execution remain your standard. Besides this, you exude charm, intelligence and warmth! But what should be the ultimate result of your efforts?
Each of us owes a responsibility to our shareholders through the organizational chain of command. Those who have invested their own equity into our company expect that the value of their investment will grow as fast as possible. Our challenge to find more revenue, improved margins, and a higher return on assets continues. That sounds very “text book”, but we need a practical method to help us direct our efforts for maximum shareholder impact – a map to higher enterprise value through the supply chain.
Benchmarking studies may tell us that more treasure waits for our shareholders based on comparison with peer businesses. Ok, that’s good to know, but capturing this treasure remains elusive. If the supply chain were (as the term implies) really a linear, sequential relationship of entities exchanging goods, information, and currency in a binary, stepwise flow, it might not be so difficult.
However, we know that the supply chain really is a complex network of inter-dependent people, organizations and locations and that goods, data and currency pulse from node to node in almost any direction following the path of least resistance. This “value network” (see Figure 1 for an example) contains the money we seek. But, since the movements of material, data and cash are continuous, dynamic, and interdependent, the benchmarking results that tell us we have potential do not often change, despite our efforts to the contrary.
Example Value Network Concept
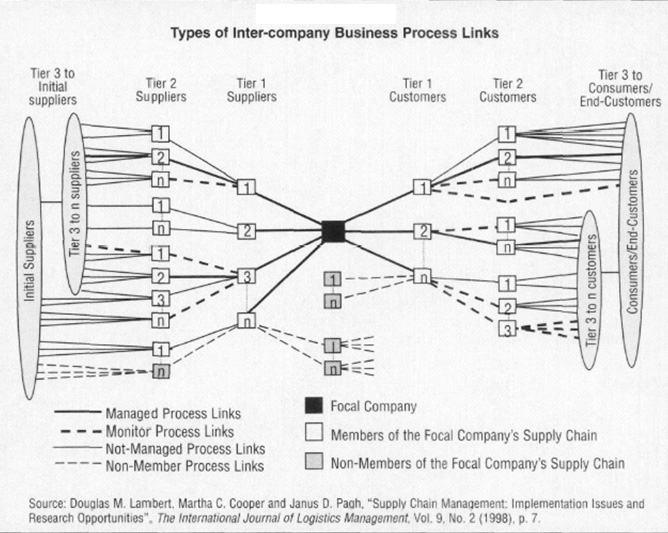
Source: Douglas Lampert and Terrance Pohlen,
in The International Journal of Business Logistics
An Approach We Can All Use
Most of us are people of more or less average intelligence. Some of us (including the author) have learned that we are not much more than that. But we still need to make higher quality decisions in less time. The value network is a complex machine, if not an organism. How do we prioritize our efforts to lessen undesirable business symptoms with better decision processes so that revenue growth, return on net assets, and profitability are increased?
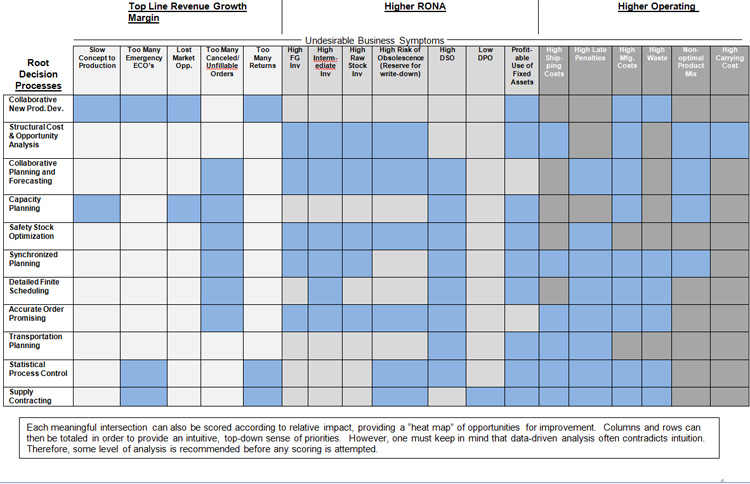
Let’s start with what we know. We know the undesirable business symptoms. These are the measurements that make our sleep fitful, cause our hair to turn gray, churn our stomach, and make some business meetings uncomfortable. Examples of these can be seen on the horizontal axis in the Process/Symptom/Value (PSV) Matrix (Figure 2). From the PSV Matrix, we see that undesirable business symptoms directly and negatively impact financial measures that determine the value of the enterprise (e.g. Economic Value Added or EVA® ). We want to ameliorate these symptoms. A symptom that does not significantly inhibit revenue growth, return on net assets, or margins can be addressed as a secondary priority.
The PSV Matrix has been composed to reflect a broad group of decision processes throughout the value network without regard to a particular methodology within a given decision process (e.g. Theory of Constraints, Lean, software applications, etc.). The PSV Matrix relates business decision processes to symptoms, ultimately allowing us to link potential root causes within each decision process to undesirable business symptoms. In the PSV Matrix, decision processes form the “y-axis”. It is helpful to think in terms of decision processes so that once the true root causes have been identified and prioritized, solutions can be addressed systemically through the improvement of a decision process.
Note that in the matrix, DSO is the abbreviation for Days Sales Outstanding; DPO is an abbreviation for Days Payable Outstanding; Typically DSO should be as small as possible and DPO should match a supply contract which is negotiated to fit the requirements for supply management to support the corporate strategy
Multiple root causes in multiple decision processes can relate to a single symptom (multiple shaded cells in a vertical column in the PSV Matrix). On the other hand, a single root cause may be causing multiple undesirable symptoms (multiple shaded cells in a horizontal row). Consequently, we must quantify and prioritize the root causes so that we know which business decision process should be attacked first.
The Process/Symptom/Value (PSV) Matrix
Since all businesses have income statements and balance sheets, the formula for corporate value (e.g. EVA®) remains the same, though degree of challenge in moving the needle on each factor in the formula may vary across industries. The symptoms themselves as well as the emphasis and criticality can also vary across industries, but much commonality will persist for manufacturing firms.
How can this process and tool be best leveraged to deliver real and lasting supply chain improvements? We'll tackle that subject in part two of this article next week.
What are your thoughts on our commentator's perpspective? Let us know your thoughts at the Feedback button below.
|