Larkin Says: |
 |
| Truckload demand Demand continues to fall below the 5-year moving average, but 2015 YTD performance is still below average. |
|
What Do You Say?
|
|
|
|
New Expert Insight Column on SCDigest: We have partnered with Stifel Financial Corp. to publish its weekly recap of the week in transportation, written by well-known analyst John Larkin. Check the SCDigest home page each Monday morning for the latest edition.
Takeaways from This Week's Fundamental Research
Thus far this quarter, demand indicators in the spot market and volume figures on the rails have been soft. On the rails, a slowdown in the domestic industrial economy has contributed to a reduction in rail ton miles (RTM) as, for example, coal carloads are being substituted with intermodal units.
On the trucking side these indicators are a better example of the balance of the market, given they represent shippers going to load boards to find additional capacity. Furthermore, the year over year comparisons are such that it makes 2015 look much softer than it truly (in our view) is.
More details on each of these metrics are found within this report.
We currently hold Buy-rated names on five equipment manufacturers/leasing companies [(TRN, $27.24), (GBX, $48.01), (WNC, $12.68), (ALSN, $29.85), (R, $89.08)], three truckload companies [(SWFT, $23.23), (CGI, $21.05), (KNX, $26.90)], three less-than-truckload companies [(CNW, $39.51), (SAIA, $38.61), (ODFL, $68.87)], one railroad [UNP, $96.77], one short line railroad holding company [GWR, $77.56], one logistics company [XPO, $45.74], and one passenger transport play [STB, $4.62].
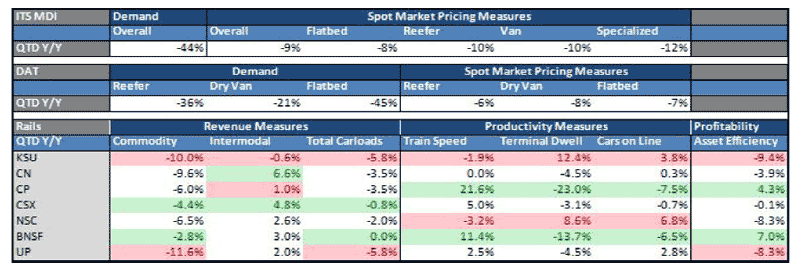
Some key logistics sector data in shown in the the table below:

Previous Columns by
John Larkin |
|
|
Key Insights from the Analysis of Industry Data Feeds
Trucking & Logistics:
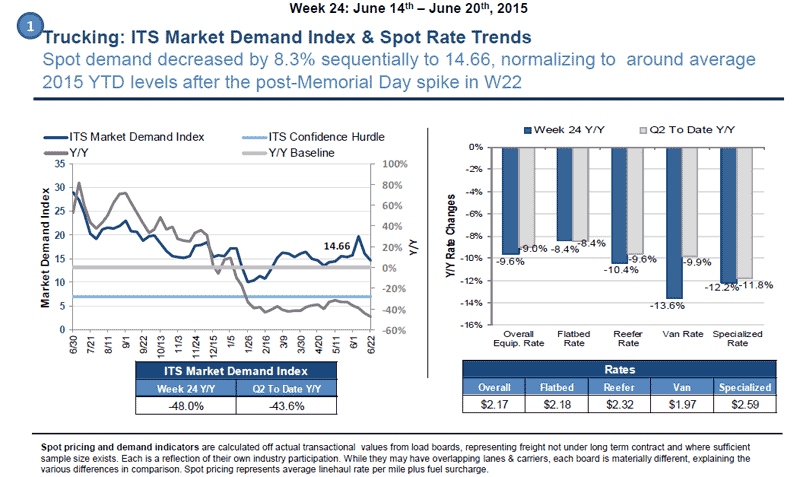
In week 24, spot demand was mostly negative, as this week continued to normalize back to the pre-Memorial Day levels seen in W21. The ITS Market Demand Index (MDI) fell by 8.3% to 14.66 after hitting a new peak for 2015 YTD in W22. Load-to-truck ratios on DAT were down across the board for the week as they continued to normalize from the effects of W22 as well. Flatbed, dry van, and reefer decreased by 22.8%, 16.7%, and 9.1%, respectively, although all have dropped below W21 levels.
DAT spot rates were negative this week as well. Reefer and flatbed both dropped a penny from last week to $2.22 per mile and $2.19 per mile, respectively. Dry van fell two cents from last week to $1.88 per mile. ITS Market Rates decreased almost across the board this week, except for the overall equipment rate—which remained flat -and the flatbed rate - which increased 0.5%.
Demand (MDI) continues to fall below the 5-year moving average, but 2015 YTD performance is still below average. The latest spot demand for this week is about 55% lower than last summer's peak, but it should be understood that 2014 had extremely inflated comps. To compare, W24 of 2015 is down 14.2% when compared to the comparable week in 2013, yet down an even greater 48.6% when compared to the comparable week in 2014.

Rail:
Total unit volume (i.e., commodity carloads and intermodal units) in W24 were only slightly up this week for a total sequential increase of 0.2% this week. Only CP, BNSF, and NSC showed decreases of 4.4%, 2.4%, and 2.3%, respectively. The best performers were CN and KSU, which increased their volume by 4.9% and 3.5%, respectively.
Total commodity carloads (up 2.0% sequentially this week) showed similar patterns in strength and weakness among rails as in total unit volume. The only rails with decreases in their commodity carloads this week were CP, BNSF, and NSC. CN was the best performer - its commodity carloads increased 7.2% this week. However, it was the worst performer last week based on commodity carloads (decreased 4.9%). In an opposite move from commodity carloads, intermodal carloads decreased by 2.0% this week. The only rails with increases were KSU and CN, which increased intermodal carloads by 3.1% and 1.8%, respectively. The weakest performer was again CP, which decreased its intermodal carloads by 9.5% this week..
Across Class I's as a whole—intermodal containers, motor vehicles and equipment, and coke were up the most this week y/y. Only UNP and KSU did not show an increase in intermodal containers this week. Similarly to the past few weeks, most Class I rails have suffered from the weak coal volumes, which have persisted for the last several weeks due to regulations and a soft U.S. dollar. This week y/y, notable weaknesses included coal for UNP and NSC and metallic ores for CN.
Class I Performance metrics were mostly negative this week, and still remain relatively unimpressive. On a weekly sequential basis, velocity mostly decreased—notably NSC (down 4.1%) and CSX (down 3.3%). Terminal dwell favorably decreased by only 0.3%, with strength from NSC (down 1.6%), CN (down 1.4%), and KSU (down 0.8%). Sequentially this week, the rails have kept their cars on-line flat, but decreased them by about 0.6% y/y. In y/y terms, the rails have cut out around 7,600 cars on-line relative to last year. Finally, overall asset efficiency is generally up from last quarter; however, on a total y/y basis more cars on-line have been required to move a like-for-like number of goods.
Any reaction to this week's note? Let us know your thoughts in the Feedback area below.
|