Larkin Says: |
 |
| Several retailers are saying that a material amount of freight would not return to West Coast ports as companies look to diversify their supply chains. |
|
What Do You Say?
|
|
|
|
New Expert Insight Column on SCDigest: We have partnered with Stifel Financial Corp. to publish its weekly recap of the week in transportation, written by well-known analyst John Larkin. Check the SCDigest home page each Monday morning for the latest edition.
Takeaways from This Week's Fundamental Research
Intermodal volumes remain depressed, but begin to recover. This past week intermodal volumes on east & west coast rails (i.e. CSX, NSC, UNP, BNSF) saw volumes down 9.5% year-over-year, as compared with being down 16.9% y/y in week 7. It seems as if though the issues on the west coast were noticeable in nature, volumes do look to be rebounding sequentially.
Multiple retailers, including the Dollar General and Disney, have commented recently that they had begun preparing to divert freight from the West Coast ahead of the crisis and anticipated that a material amount of freight would not return as companies look to diversify their supply chain.
BNSF crude by rail train crashes and burns one week after the keystone pipeline is vetoed. Even railroaders admit that pipelines are far more safe (and economical) than crude by rail. But, Washington seems to be in gridlock as to how to jump the political hurdle toward a more robust pipeline strategy. This delay, however, actually acts to increase the strategic hurdle required for promoters of the Keystone pipeline to justify it versus crude by rail; this is largely because the more crude the rails more the more they invest in their infrastructure further improving the efficiency of their railroading operations and eroding the cost benefit advantage of pipeline.
The question is unfortunately becoming – how many trains need to crash before D.C. changes their tune? Until then, railroads will continue to ship.
Previous Columns by
John Larkin |
|
|
Key Insights from the Analysis of Industry Data Feeds
Trucking & Logistics:
Spot demand was up on a sequential basis in W08 across all indicators. The ITS Market Demand Index (MDI) measured 15.12 in W07 (up 18.8% sequentially). Load-to-truck ratios on DAT were up entirely across the board. Refrigerated, dry van, and flatbed load-to-truck were up 20.3%, 18.5%, and 8.8% sequentially, respectively.
Spot rates were only slightly up in W08 with DAT pricing showing stagnation given the loosening supply & demand. DAT spot pricing showed 0.5% sequential increases in each of the refrigerated, flatbed, and dry van segments. ITS' rates offered a comparatively larger increase sequentially in all areas except for specialized rates, which fell 0.7%. In comparison to the 0.5% sequential increases in DAT spot pricing, refrigerated, flatbed, and dry van respectively showed 2.9%, 0.5%, and 2.7% sequential increases for ITS rates.
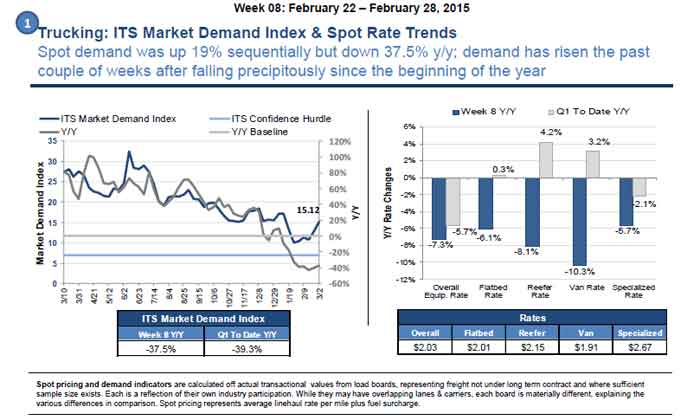
Spot has started to rise slowly after its precipitous drop during the first part of 2015. After a full year of generously inflated y/y comps in 2014, it looks as if demand is normalizing back to levels seen in 2013. Since the first half of this quarter did not give us as harsh of a winter as last year, we did not see the dramatic overflow demand coming out of railroads stuck in a wintry tundra; however, winter weather has worsened over the last couple of weeks which perhaps lent to the higher spot demand
Rail
Total unit volume (i.e. commodity carloads & intermodal units) showed a sequential increase of 6.7% after seeing a 9.8% sequential decrease the week prior. After each of the seven Class I rails showed sequential declines last week, all except for KSU (which gave a 1.5% decrease) increased sequentially during W08. Most notably, CP increased its total unit volume by 25.1%, sequentially. On a y/y basis, however, total unit volume decreased by 5.8% with CSX and NSC being the y/y laggards of the group (down 11.9% and 9.3%, respectively).
Total commodity carloads also showed a recovery from last week with a 3.6% sequential increase. CP led this category as it increased its total commodity carloads by 25.5%, sequentially. Despite positive sequential performance, total commodity carloads were still down 4.5% on a y/y basis. In intermodal carloads, there was a sequential increase of 11.0% (once again with CP leading at 24.3%) and a y/y decrease of 7.4%. Across Class I's as a whole - stone, sand & gravel, intermodal containers, and motor vehicles & equipment are up the most QTD y/y.
Class I performance metrics still remain unimpressive, despite improvements in certain metrics. The low carload demand has been too short-lived to sustain a correction in service. Velocity is up 1.2% sequentially and up 1.7% y/y. Terminal dwell is down 0.4% sequentially, but up 4.5% y/y. Cars on-line are down 0.1% sequentially and up 0.8% y/y. While these numbers don't sound dramatic, it is important to keep in mind that we have now lapped 2014's winter service impact, so these numbers are in relation to a soft baseline
Any reaction to this week's note? Let us know your thoughts in the Feedback area below.
|