Global On-Time Container Delivery Analysis
Choosing an Ocean Carrier Based on Performance Measurements
Only 47% of containers booked in the past year were delivered in a timely manner.
38% of all late deliveries are not directly related to vessel schedules.
(Source: OceanMetrics)
OceanMetrics has the ability to match a carrier’s original booking confirmation against the status indication that the container is ready for pick-up by the shipper. This information allows an accurate measurement of the on-time reliability of container deliveries. As the measurement is tied directly to the actual delivery of the container itself, it automatically includes any delays incurred irrespective of vessel schedules and routing. This makes the OceanMetrics measurement unique.
The total number of TEU moved globally is subject to quite some uncertainty, however OceanMetrics’ data captures 20-30% of all containers moved globally. Using the OceanMetrics database to analyze global on-time container delivery therefore provides a solid view of the status of the industry.
Ivinski Says: |
 |
| Just as some shippers want very high reliability for time sensitive products for example, others might be perfectly content with a low on time delivery performance. |
|
What Do You Say?
|
|
|
|
Methodology
Every single container delivery is matched against the corresponding booking confirmation, when both of these are available in INTTRA’s OceanMetrics platform. This data is combined into a weekly measurement of on-time delivery reliability. Additionally, in order to eliminate statistical fluctuations in the data, the data is always calculated as an average over the past 13 weeks.
OceanMetrics provides this data for the past 52 weeks, wherein each week’s total data then contain the arrival of approximately 3 million TEU.
 The Results The Results
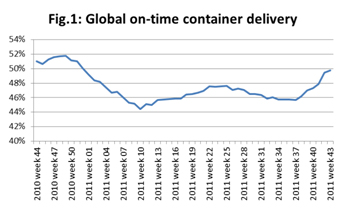
The first result is a simple calculation of the global on-time delivery development. Figure 1 illustrates this development, and it is seen that the global average over the past year has been 47% on-time delivery of containers, albeit with some significant fluctuations over the year. A high-point is reached towards the end of 2010 with 52% of all containers being delivered on time. Then there is a decline to a low point in week 10 in 2011 where only 44% of all containers were delivered on time. The latest data indicates that in the past 13 weeks, 50% of all containers were delivered on time.
|


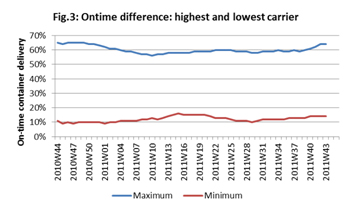 The data tells us that the differences are very large across the individual carriers. Figure 3 illustrates the highest and lowest on-time delivery statistics over the past 52 weeks. The lines in figure 3 do not represent any single carrier, but simply the on-time delivery statistics for the highest or lowest performing carrier that particular week.