SEARCH searchBY TOPIC
right_division Green SCM Distribution
Bookmark us
sitemap
SCDigest Logo

SCDigest Expert Insight: Supply Chain by Design

About the Author

Dr. Michael Watson, one of the industry’s foremost experts on supply chain network design and advanced analytics, is a columnist and subject matter expert (SME) for Supply Chain Digest.

Dr. Watson, of Northwestern University, was the lead author of the just released book Supply Chain Network Design, co-authored with Sara Lewis, Peter Cacioppi, and Jay Jayaraman, all of IBM. (See Supply Chain Network Design – the Book.)

Prior to his current role at Northwestern, Watson was a key manager in IBM's network optimization group. In addition to his roles at IBM and now at Northwestern, Watson is director of The Optimization and Analytics Group.

By Dr. Michael Watson

January 19, 2016


Why You Need to Understand the Trade-Off between Precision and Recall

With the Rise of Predictive Analytics, Understanding Enough to ask the Right Questions Helps Your Analytics Team Fine Tune the Model to the Specific Business Needs


Dr. Watson Says:

start
Knowing about precision and recall will help you guide your team to build the best models for your business.
close
What Do You Say?


Click Here to Send Us Your Comments
feedback
Click Here to See Reader Feedback


This was co-authored with Sam Hillis and Sara Lewis of Opex Analytics.  Their biographical information can be found at the end of the column.

Recent advances in computing and availability of data have driven an explosion of enthusiasm around predictive analytics. As these algorithms and technology spread through companies and industries, it has become increasingly important to have knowledge of key concepts that extend beyond buzzwords.

There are two standard types of predictive analytics.  The first type, which you are likely familiar with, is regression.  In regression, you are predicting a numeric value.  You have seen regression in action when forecasting sales for the next month or year.  The other type is classification.  You are likely to start to encounter this more as your organization embraces analytics. Classification is predicting a category or whether an event will happen. 

Classification algorithms are likely to help the supply chain with the following types of problems:

 •

Predicting whether a product will stock out


Predicting whether a new product is likely to be a hit or a dud after the first few weeks of its release


Predicting whether items are likely to become obsolete


Predicting whether a machine or part will fail


Predicting whether a product meets your quality standards  (See potato chip example)


Predicting whether an order is likely to be late


Predicting if a truck driver is likely to get into an accident


Previous Columns by Dr. Watson

The Three Use Cases for Data Scientists

Learn Python, PuLP, Jupyter Notebooks, and Network Design

EOQ Model and the Hidden Costs of Fixed Costs

CSCMP Edge - Nike Quote: "It is All an Art Project Until you Get it on Someone's Feet"

Supply Chain by Design: Why Business Leaders should think of AI as an Umbrella Term

More


Based on the types of problems we are looking at, it’s clear that these predictive analytics algorithms are soon going to play a more important role in the supply chain. 

But, how do you work with the technical team to make sure the model is as good as it can be for you?

With regression, we know to ask about the forecast errors and statistical significance of the variables. 

With classification algorithms, we have new metrics to ask about:  precision and recall.


To explain precision and recall, we have found the fishing example to be helpful.  In this example, we have a pond of fish and we know the total number of fish within.  Our goal is to build a model that catches red fish (we may say that we want to ‘predict’ that we catch red fish).  In our first test we have a model that consists of two fishing poles with bait made from a recipe based on scientific analysis of what red fish like.  The precision metric, is about making sure your model works accurately (or that the predictions you make are accurate).  With our fish example, this means that the fish caught with the special bait are, in fact, red.  The following test shows great precision—the two fish caught were both red.   
We were trying to (or predicted we would) catch red fish, and all of the fish that we caught were red.

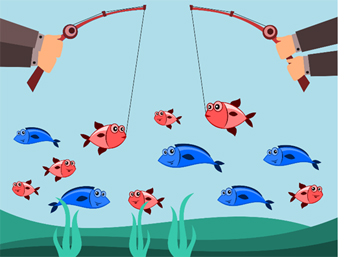
There is one small problem here though.  We knew there were a lot more fish in the pond and you might notice that when we looked closer we also found a lot more red fish that we didn’t catch.  How can we do a better job of catching more of the red fish?


Here is where our other measure, recall, comes into play.  Recall awards us for catching more of the red fish.  In our first model we didn’t do a very good job of this.  So although our precision was good our recall was not so good.

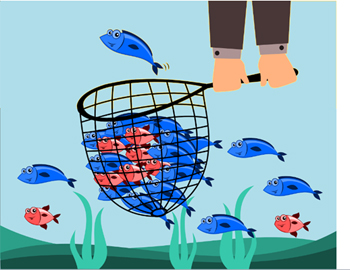
Knowing this we decide to develop a new model using a fishing net and a new bait recipe.  The picture below shows the result of our first test with this new model.  We caught more of the red fish!   Our recall has definitely improved. 


Unfortunately you will notice that we caught a lot of blue fish in our net as well.  We weren’t trying to catch them but they ended up in our net anyway.  We were trying to (or predicted we would) catch all red fish and, while we caught more red fish, many of the fish caught were blue.  Our precision has suffered even though we improved our recall.

This is the fundamental trade-off between precision and recall.  In our model with high precision (most or all of the fish we caught were red) had low recall (we missed a lot of red fish).  In our model with high recall (we caught most of the red fish), we had low precision (we also caught a lot of blue fish).

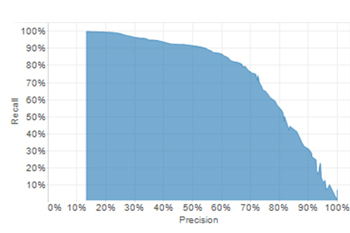
When building a classification model, you will need to consider both of these measures.  Trade-off curves similar to the following graph are typical when reviewing metrics related to classification models. 

The thing to keep in mind is that you can tune the model to be anywhere along the frontier. 


For a given model, it is always possible to increase either statistic at the expense of the other. Choosing the preferred combination of precision and recall can be considered equivalent to sliding a dial between more or less conservative predictions (i.e. recall-focused vs. precision-focused). It is important to note that this is for a given model; a better model may in fact increase both precision and recall.

In choosing the correct balance of precision vs. recall you should take a closer look at the problem you are trying to solve.

Let’s relate this back to our supply chain problems, if we are predicting truck driver accidents, we may want a high recall (and be ok with low precision).  That is, we want a list that captures all the high risk drivers.  We can then do extra training and extra monitoring.  And, we are ok that this list may also include a lot of drivers who wouldn’t have had accidents anyway.  Our money spent on training and monitoring these already good drivers is worth it if we prevent just one severe accident.

On the other hand, if we are predicting stock outs, we may go for precision.  If 200 of my 5,000 items will stock out next month, I may want high precision.  That is, I would be happy if you gave me a list of the high precision list of 60 SKUs most likely to stock out.  I’ll expedite and take extra measures with these 60 SKUs.  I’ll still miss 140.  But, that is better than the model giving me a list of 600 SKUs.  The list of 600 has most of the 200 in there, but I’m spending time and money on 400 items where there wasn’t going to be a problem.  

Final Business Thoughts

Managers will soon see more and more classification problems.  Knowing about precision and recall will help you guide your team to build the best models for your business.  

Extra Material:  Details on the Calculations

To truly understand the calculations, we need to understand the following conditions: 

  • True Negative: we predicted that we wouldn’t catch a blue fish and we didn’t
  • False Negative: we predicted that we wouldn’t catch a blue fish and we did
  • True Positive: we predicted that we would catch a red fish and we did
  • False Positive: we predicted that we would catch a red fish and we didn’t


Precision is the percent of times that we predict an event will occur and it actually does; for example, with the net we catch 17 fish, but only 6 are actually red giving a precision of 6/17 ≈ 35%: (true positives / (true positives + false positives)).  Recall is the percentage of events that occur that we predict will occur; again, with the nets we catch 6 of the 8 total red fish giving a recall of 6/8 = 75%: (true positives / (true positives + false negatives)).


Sam Hillis
Data Scientist
Opex Analytics

Sam is a professional data scientist with a background in operations research. He received his Masters Degree in Analytics from Northwestern University. While at Northwestern, he was able to complete several projects with Fortune 500 companies and gained a deep understanding of data science tools such as R, Python, Hadoop, MapReduce, visualization tools, and other statistical and machine learning tools. He also has a background in operations research and is familiar with optimization and supply chain analysis tools. - See more at: http://opexanalytics.com/about-us/#sthash.tECjnh4D.dpuf
   

Sara Lewis
Solution Specialist
Opex Analytics

Sara is a subject matter expert in analytics and supply chain optimization. Throughout her career she has worked on many complex supply chain analytics projects for companies around the world. Sara started her career working in Industry as a Supply Chain Specialist at Dupont. She then moved on to join the Supply Chain applications company formerly known as LogicTools, which was sold to ILOG in 2007 and IBM in 2009. Sara worked hands on with clients in all areas including sales, training and consulting as well as contributed significantly to the development of applications internally.

Sara is also co-author of the book “Supply Chain Network Design,” which was published in 2012 and is being used by practitioners and a number of universities. She is a frequent guest lecturer on the topic of Network Design at several prominent U.S. Universities.

​Sara Lewis graduated from Penn State University with degrees in Business Logistics and Management Information Systems. - See more at: http://opexanalytics.com/about-us/#sthash.tECjnh4D.dpuf


Let me know your thoughts at the Feedback section below.
 

Recent Feedback


No Feedback on this article yet


.