| |
|
| |
|
 |
Supply
Chain by the Numbers |
| |
|
| |
- July 22, 2021
|
| |
|
| |
|
| |
|
| |
Driver Shortage to Expand, ATA Economist Says; Ocean Carriers Laying on Big New Fees; US Manufacturing Recovery is Losing Steam; Report Estimates CO2 Emission for Big Container Importers |
| |
|
| |
| |
| |
| |
105,000 |

|
| That is the estimated US truck driver shortage that we are likely to see in 2023, according to American Trucking Associations chief economist Bob Costello, during a presentation to the Federal Motor Carrier Safety Administration’s Motor Carrier Safety Advisory Committee meeting on July 20. That compares to about 60,000 currently – and 160,000 by 2028. Pay is one factor in attracting and keep drivers in the industry. But the length of haul - and the ability for drivers to get home regularly – is not surprisingly a big factor in drivers exiting the sector. “I think this really gets to the lifestyle issue,” Costello said. Another factor is the FMCSA’s Drug and Alcohol Clearinghouse, a database of commercial driver license holders’ drug and alcohol violations. It may be taking risky drivers off the road, but is also having a growing impact on the driver pool, as few drivers reapply to be eligible again. |
|
|
| |
| |
|
|
|
| That was the level of the US manufacturing output index for June, according to the monthly report published last week by the Federal Reserve. That was basically flat with January's reading of 98.2, though well above the low point in the recession in April 2020 at about 83. Nevertheless, it appears the US manufacturing recovery has lost steam. What’s more, the June score is still well below the 105 level in February 2020 right before the COVID crisis began in the US . In fact, at 97.9, it means US manufacturing is below baseline 2012 levels (index = 100) now nine long years later. US factoy utilization came in at 75.3%, again flat both with the numbers for January and May, and below the long run average from 1972 to 2020 of 78.2%. |
| |
| |
|
|
| |
| |
3.7 Million |
|
That’s how many metric tons of CO2 emissions from shipping ocean containers were generated by Walmart’s supply chain in 2019, according to an estimate in a new report from environmental groups Pacific Environment and Stand.earth. That put Walmart at the top of the list, far ahead of number 2 Ashley Furniture at 2.2 million tons. To make the estimate, the researchers first looked at the Journal of Commerce’s ranking of the biggest US importers by volume. They then commissioned the University Maritime Advisory Services (UMAS), which has access to other maritime import databases, to cross-reference the public data with their own proprietary information. Together, they matched retailers’ individual shipments to specific vessels. Based on the ships’ voyages, they were able to estimate fuel consumption and the resulting emissions. Their estimates are likely low, because the researchers weren’t able to verify all the cargo voyages made by subsidiary companies, nor we will note did they measure for containers going to non-US ports. And sorting out emissions responsibility with ships making several stops, is tricky, so these numbers are really just estimates. Target, Dole and Home Depot round out the top 5. |
| |
| |
| |
| |
| |
|
|
|
| |
|
 |
| |
 |
![]() |
 |
|
| |
 |
Feedback |
|
|
|
![]()
|
No Feedback on this article yet.
|
|
![]() |
|
|
|
![]() |
 |
![]() |
 |
|
| |
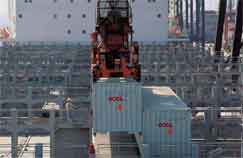 That is a new surcharge per 40-foot container for moves from China to the US and Canada soon to be assessed by German ocean container line Hapag-Lloyd, according to a letter it recently sent to customers. The letter said the new fee is a result of “extraordinary demand from China and the resulting operational challenges along the transport chain.” Hapag-Lloyd said the surcharge would be implemented beginning August 15 and would “replace other ad-hoc surcharges like the SGF” (shipment guarantee fee). Hapag-Lloyd is just one of nearly all carriers implementing such fees. TheLoadstar.com reports, for example, that some carriers, including Zim, Cosco and ONE, have been charging Asia to US west coast shippers more than $7,000 per container for so-called “value-added products,” including guarantees a container will get on a sailing, on top of their normal spot market rates. In fact, it appears a growing number of carriers, depending on the lane, are now ignoring contracts and forcing shippers to accept their sky-high spot market prices and the significant surcharges. “This madness has to stop,” one freight forwarder from Great Britain told The Loadstar.