We recently completed our analysis and comment on the Q2 results from publicly traded truckload, rail, and LTL carriers.
As part of that process, we captured some slide graphics from the earnings presentations of the four public raol carriers, but ran out of room to run them in our rail article, and so present them here as our multi-graphic of the week. Together, they give you a good sense of where the US rail industry is right now.
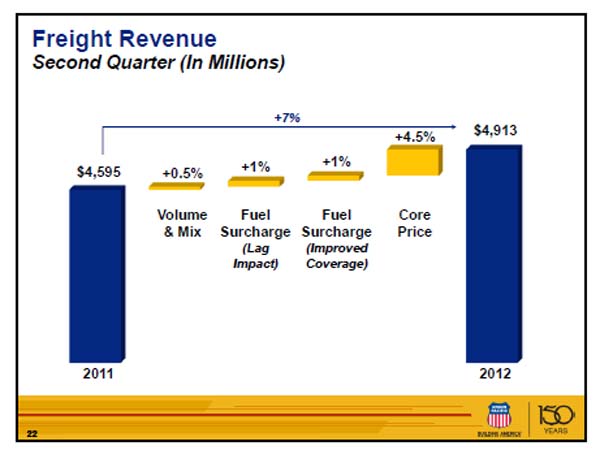
The graphic below is from Union Pacific, which had a blow out quarter in terms of profit growth. As can be seen, the preponderance of its Q2 revenue growth came from a strong 4.5% rise in core rate growth. That 4-5% price growth has been consistent for quarter after quarter for the rail carriers, and most said they expect more of the same for the rest of 2012.
Union Pacific Revenue Growth Drivers Q2 2012
All four of the carriers touted focused efforts to improve productivity, which is helping to juice profits even as rail car volume growth slows, especially as coal shipments are falling like a rock for all of them, down 11-17% across the group.
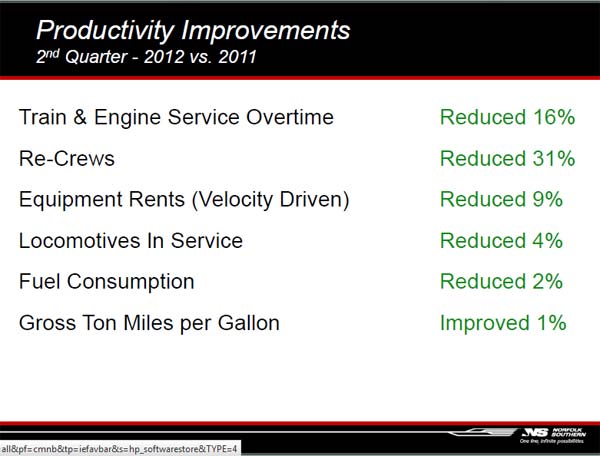
Below is a graphic from Norfolk Southern showing the great progess it has made in improving productivity across many areas of its operations in Q2. 16% reduction in overtime? That is huge.
Norfolk Southern Productivity Gains
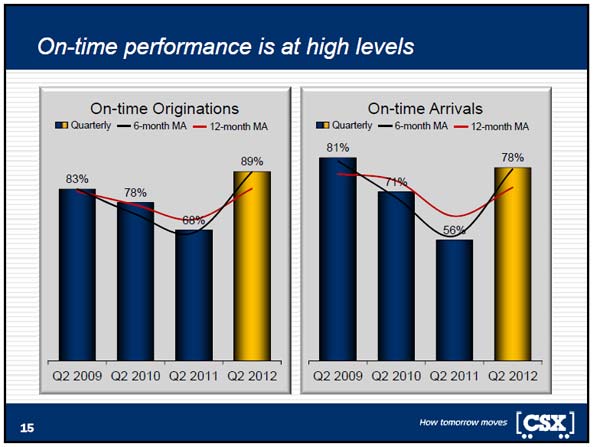
After some dips in recent quarters, service levels improved markedly in Q2 for all the carriers. Below is a graphic showing CSX's major improvement in on-time originations and arrivals in the second quarter.
CSX On-Time Performance Q2 2012
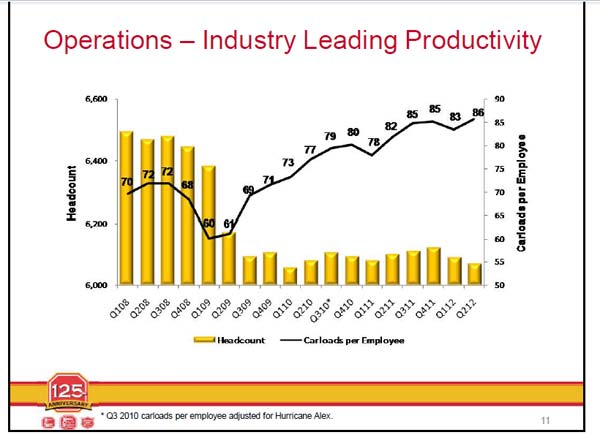
Finally, Kansas City Southern is likewise on the productivity bandwagon, as shown in the chart below. Look at the amazing growth of car loads per employee at the carrier since mid-2009.
Kansas City Southern's Improvement in Car Loads per Employee
All that, as they say, is the way to run a railroad.
Have a reaction to our Supply Chain Graphic of the Week? Send us your comments at the Feedback button below. |


