2021 in Supply Chain in Numbers and Charts
As I wrote last week, it has been a very strange first half of 2021, with a strong post-pandemic recovery, shortages of everything, rising inflation, a ship stuck in the Suez Canal and more. (See The Top Supply Chain Stories by Month 2021
This week, we offer our popular look at 2021 in supply chain numbers and charts.We always start with a check on the US and global economy, as that has such an impact in the end on supply chain practice.
| GILMORE SAYS: |
WHAT DO YOU SAY?'
In fact, the growth of all retail sales (including ecommerce) was up 13.1% in Q3, almost double the increase in on-line sales. Not sure I trust those numbers.
Send us your
Feedback here
|
Real US GDP was down a near record 3.5% in 2020, as reported in early 2021, though it was trending up as the year ended.
Q1 2021 real GDP then increased a robust 6.4% on an annualized basis, followed by 6.7% growth in Q2. But Q3 saw a sharp slowdown in growth to just 2.3%. Estimates for Q4, however, are greater than 6% from most economists.
What that means in part is that US real GDP growth in 2021 will exceed 3% for the first time since 2005, before which that level of growth was commonplace. It should be noted, however, that level of growth came in part as a result of very weak 2020 levels.
The World Bank estimates the global economy will grow 5.5% in in 2021 when the final numbers come in - the highest growth level in 80 years. It now expects 2022 to slow to 4.1% growth, with the decline from 2021 blamed on the new global virus spread and on-going supply chain challenges.
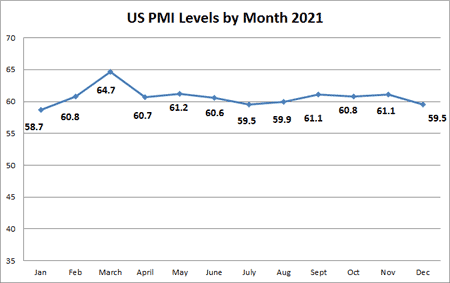
The US Purchasing Managers Index from the Institute of Supply Management was a dismal 41.5 in April 2020, well below the key 50 mark that separates US manufacturing expansion from contraction. But consistent with GDP numbers since then, it has been on a roll ever since, especially in 2021, showing manufacturing expansion now for 19 consecutive months.
As seen in the chart below, the PMI was at a score of 58 or higher for each month in 2021, very high levels, and above 60 for 8 of those 12 months. It reached a high of a very robust 64.7 in March, then hovered right around that strong 60 level for the full rest of the year.

However, another view of US manufacturing strength is the index on US factory output from the Federal Reserve - and that tells a somewhat different story.
The index level for November (the last data point we have) came out at 100.6, just a couple of percentage point above January's 98.2, but 4.6% above November 2020. It was also well above the low point in the recession in April 2020 at about 83.
The November score still trails the 105 level in February 2020 right before the COVID crisis. In fact, at 100.6, it means US manufacturing is just above baseline 2012 levels (index = 100) now 10 long years later.
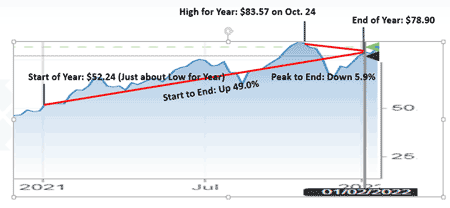
It was nothing but higher prices for oil in 2021, fueling overall inflation. 2021 started at near the low mark for the year for West Texas Crude, at $53.40 per barrel. The price rose steadily for the rest of the year, reaching a peak of $83.57 in October. Following a modest decline from there, oil ended the year at $78.90, for an increase of 49% from the start of the year to the end. Many believe oil will head still higher in 2022.
2021 Oil Prices

Similar story for US on-the-road diesel prices, though the price gains were a bit more muted. Average retail prices started the year at $2.64 per gallon, hit a high of $3.73 in mid-November, and ended at $3.61. That made the rise from start to end of 2021 at 37%.
reight volumes were surprisingly not that strong. Through November, the ATA Freight Tonnage Index was basically flat, up just 0.3% - and well below levels before the pandemic. Since the baseline year of 2015, tonnage measured by the ATA is up 15% though, roughly a 2% average gain per year - not a lot
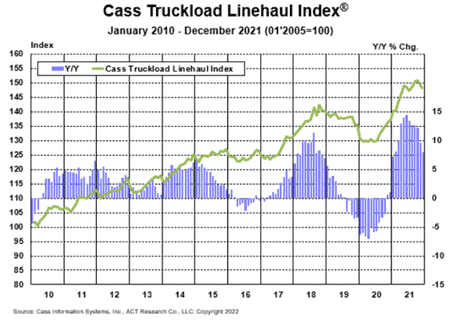
Despite the low growth in volumes, truckload rates soared in 2021. The Cass Linehaul Index tracks per mile truckload contract rates in the US before any fuel surcharge or other accessorial fees. The index was up 12-14% year-over-year from May through October, with still sizable gains of 9.6% and 8.0% in November and December, respectively. (See graphic below.)

It was a decent year for US railroads, though again relative to weak volumes in 2020. Total US rail traffic for 2021 was up 6.6%, with the intermodal component up 4.9%.
In terms of ocean container shipping rates, the China Containerized Freight Index started the year at about 2700 and ended at 3400, a rise of 26% to ship a container on average out of China. But the increase was really higher than that, with larger hikes in some trade lanes (such as to the US West Coast), and many shippers having to pay huge extra fees to get their boxes moved, as volumes soared. Carriers were said to just ignore contract rates, with costs reaching a crazy $15,000 to as much as $20,000 to move a 40-foot box from China to the US.
After a torrid 2020, and Q1 2021 (up 39.3%), ecommerce sales slowed, rising 8.9% in Q2 off the tough 2020 comparison, and just 6.6% in Q3, as we await the Q4 numbers. But these last two quarters are a bit of a wake-up call that even the days of 13-16% year-over-year growth seen commonly before the pandemic may be gone.
In fact, the growth of all retail sales (including ecommerce) was up 13.1% in Q3, almost double the increase in on-line sales. Not sure I trust those numbers.
In line with that Amazon said its Q3 on-line store revenue grew just 3.3% versus 2021, to about $50 billion in the quarter. Did you know that?
I have lots more but am out of space. Hope you enjoyed all this.
Any reaction to these 2021 numbers and charts? Let us know your thoughts at the Feedback button below.
|

