The State of Global Energy 2021
I have spent two of the past few week's summarizing two "State of" reports for 2021, starting with the State of Logistics report in late June and then the State of Supply Chain Sustainability last week, both coming from CSCMP (in partnership with Kearney and MIT, respectively).
This week, my review and comment on the BP Statistical Review of World Energy 2021, released by the company each year in late June/early July. The review is a sort of almanac of all matter of energy related data, now in its 70th year, and as always it is quite an interesting and educational read.
The report is full of informtion on energy production and consumption. Energy of course is at the heart of supply chain in many ways, and central to our lives. A world of relatively cheap, abundant energy would bring prosperity and more income equality to much of the world.
| GILMORE SAYS: |
WHAT DO YOU SAY?'
As a final note, BP has vowed to re-invent itself - meaning become a green energy company of some sort - by 2030.
Send us your
Feedback here
|
High energy prices have the opposite effect, as we learned in the 1970s and again in 2008.
Energy costs can have a major impact on a variety of supply chain decisions, including network design and how to optimally navigate the tradeoff curve between inventory and transportation costs.
The report is focused on data from 2020, which of course was an abberation with the virus pandemic, whch reduced business activity and thus energy consumption and production.
In an introduction to the report, BP CEO Bernard Looney notes that "the pandemic and resulting economic turmoil spilled over into unparalleled volatility and disruption in global energy markets."
The headline news from the report is that primary energy consumption fell 4.5% last year, versus what seemed like a low 1.3% gain in 2019.
This is the largest annual drop since the end of World War II, driven by an unprecedented collapse in oil demand, as the imposition of lockdowns around the world decimated transport-related consumption for much of the year.
The drop in oil consumption accounted for around three-quarters of the total decline in
energy demand - but that may not have been all the result of the pandemic. Global GDP by one estimate fell 3.27% in 2020 - not nearly as steep as the decrease in energy consumption. So efficiencies must be gaining ground.
Corbus has a Powerful Portfolio
of Demand To Fulfillment Solutions

The report also says carbon emissions from energy fell by a robust 6.3% last year That means CO2 emissions fell far more than the 4.5% drop in energy consumption, primarily through the increase consumption of lower CO2 energy sources.
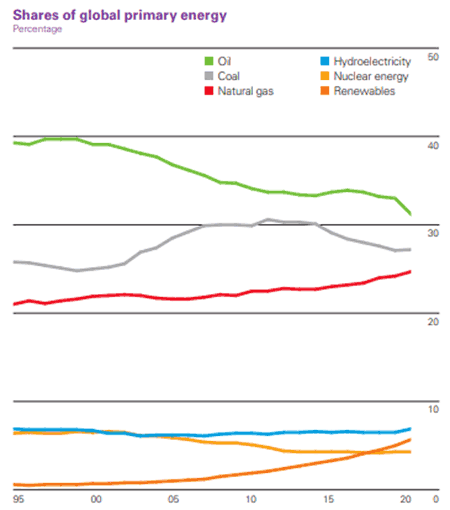
Switching gears, the chart below from the report nicely summarizes global energy consumption from 1995 through 2020 by energy source.

Source: BP
As can be seen, incremental change is low. Oil's share of energy consumption fell again, but it retains the top spot with 32% share. Coal's share reversed course and actually rose a bit in 2020 after four years of deline. It still, however, represents more than 25% of global energy consumption. Coal usage increased in China, but fell most other places.
Renewable consumption rose nicely, and reached almost a 7% share of consumption.
Other interesting data points from the report include the following:
• China posted the largest increase (2.1%) in consumption, one of only a handful of countries where energy demand grew last year.
• Oil prices (Brent crude) averaged $41.84 per barel in 2020 – the lowest since 2004.
• Oil consumption fell by a record 9.1 million barrels per day, or 9.3%, to its lowest level since 2011.
• Wind, solar and hydroelectricity all grew despite the fall in overall energy demand
• Consumption of natural gas actually fell in 2020. Nevertheless, the share of gas in primary energy continued to rise, reaching a record high of 24.7%.
• Renewable energy (including biofuels but excluding hydro) rose by 9.7%, slower than the 10-year average of 13.4%.
• Solar electricity rose by a record 20%. However, wind provided the largest contribution to absolute renewables growth.
• Consumption of nuclear energy fell by 4.1%.
As a final note, BP has vowed to re-invent itself - meaning become a green energy company of some sort - by 2030.
To that end, CEO Looney writes that "Yes, the world needs more low carbon companies. But maybe more than anything, it also needs existing energy companies to decarbonize and in so doing use their scale and expertise to help bring about the deep and complex rewiring and replumbing of the global energy system that the world wants and needs to see over the next 30 years."
The full BP report is available here: Statistical Review of World Energy 2021
Any reaction to the BP report data? Let us know your thought at the Feedback section below.
|


.gif)


.gif)


