2019 Supply Chain in Numbers and Charts
With a couple of days still left in January, I am at last wrapping up our review of the supply chain in 2019, this week we offer our popular look at the past year in numbers and charts.
Three weeks ago, I summarized what I thought were the key supply chain themes and trends of 2019 (see Review of the Year in Supply Chain 2019). Then with a week off to write a Trip Report for the National Retail Federation Big Show, last week I posted the top stories in each month in 2019 (see Top Supply Chain News by Month in 2019.)
So, let's get right to it the numbers and charts.
| GILMORE SAYS: |
After a torrid 2018, the Cass truckload Linehaul Index,which tracks truckload rates, slowed considerably here in 2019?
WHAT DO YOU SAY?
Send us your
Feedback here
|
We always do a check on the US and global economy, as that has such an impact in the end on supply chain practice.
Q1 started off the year strong enough at 3.1%,then fell to 2.0% in Q2 and 2.1% in Q3. The first estimate of Q4 and full year GDP was just released, and shows Q4 growth of a modest 2.1% and a full year 2019 increase of a similarly lukewarm 2.3% - though feels better than that.
So, yet again another decent economic year but one that fell short again of full year growth of 3%, which amazingly has not been reached since 2005, continuing a record span in failing to reach that mark. Do we need "Bush-anomics?"
Partly as a result of US tariffs, China's real GDP growth was jut 6.1%, a great number for most economies but down from 6.6% in 2018 and far from the near 10% seen regularly not that many years ago.
It might actually be worse than that - many believe the official number is well overstated.
The International Monetary Fund expects the global economy to grow 3.3% in 2020, up from from 2.9% in 2018 - but warns there are many risks, especially expansion of trade wars if the new US and China deal falls apart.
The IMF also said global trade volumes grew an anemic 1.0% last year, versus a better 3.7% in 2018, which itself is well below the numbers seen before the Great Recession.
In the US, the IMF economists foresee 2020 growth of a lukewarm but manageable 2.0%.
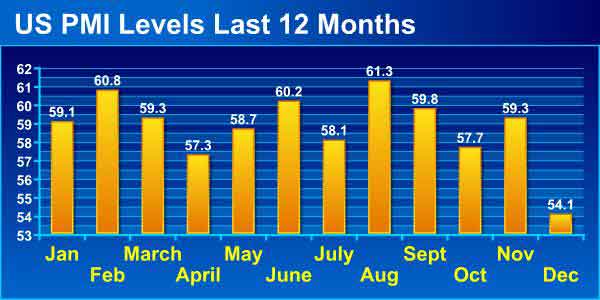
The US Purchasing Managers Index from the Institute of Supply Management, which tracks US manufacturing growth, actually told a worse tale than what was seen in the overall economy. The index, for which a score over 50 indicates US manufacturing expansion and under 50 contraction, began the year fairly strong in January, with a score of 56.6.
But as can be seen in the chart below, it was downhill from there, with the monthly measure declining almost every month before falling below 50 in August, where it stayed through December. The December number, in fact, was the lowest score since 2009.
Another view of US manufacturing strength is the monthly index on output for US factories from the Federal Reserve.
That index was flat for almost all of 2019, and the year ended with the December number coming in down 1.3% from the previous year. What is clear is that the stories on manufacturing coming back to US are anecdotal at best, and that the trend is just not showing up in the numbers.
And at a December index level of 105.2, it means US manufacturing output is just 5.2% above the baseline year of 2012 now eight years later, meaning growth of well less than 1% annually since then.
What's more, that also means current output still remains well below the peak year of 2007, when the index reached an historic high of 110.0 in December. US factory utilization has been hovering about 77%, however, not much below the average since 1972 of 78.3%.
Looking at oil, the price for WTI crude started 2019 at $46.54 per barrel, which turned out to be the lowest level of the year,
The price went up steadily until reaching a peak for the year of $66.30 in late April, a gain of 42% from the start. But it was mostly downhill from there, with a price at the end of June of $59.09, a gain of 27% since the beginning of the year, as shown in the chart below.
Despite those rather significant gyrations, US diesel prices were very stable, starting the year at $3.01, rising just a bit despite a big jump in oil prices to their April peak to their full year high of just $3.17 the week of May 6 before falling back to the $3.06 at year's end, close to the level that started the year.
Commodity and input prices were falling modestly for most of the year, after a very long period of increases before that. The ISM Prices index indicated rising input prices for 34 straight months before the beginning of the 2019, but dropped into negative territory in January. The index registered 51.7 in December, indicating raw materials prices increased after six consecutive months of decreases. The IMF Global Commodity Index was at 117 in Q4, versus 170 at the beginning of 2014.
Freight volumes were mixed, with ATA freight tonnage index up a modest 3.3% in 2019 despite lots of anecdotal tales of a weak freight environment. That, however, was just half the 6.7% growth in tonnage in 2018, though it did mark 10 consecutive years of year-over-year tonnage gains.
After a torrid 2018, the Cass truckload Linehaul Index,which tracks US truckload rates, slowed considerably here in 2019, and after a record run of year-over-year increases went negative in August and stayed negative through December, with rates down 3.3% versus 2018.
At an index level of 135.5, it means truckload rates are 35.5% above the baseline month of January 2005 - low annual growth (see chart below).
See Full Image
Cass also expects rates to be weak in 2020.
It was a tough first half for US railroads. Total US rail traffic for 2019 was down 5%, though much of that came from further drops in coal shipments. However, once fast growing intermodal traffic component was also down 5.1%.
In terms of ocean container carriers, the China Containerized Freight Index jumped to a two-year high of 890 at the end of January, coinciding with the tail-end of the great US container import boom, precipitated by the great pull-forward of 2018. But keep in mind that still means rates were more than 10% below those seen all the way back tin 1998.
The index then promptly fell below 800 late April before rising sharply in the last couple of months to about 900.
The US tariiffs clearly had an impact on Chinese imports, which were down 17% through November. But that still left a huge trade gap of $320.8 billion for the first 11 months.
The growth of ecommerce sales in the US remains strong - but is clearly slowing. Growth in Q3 was 11.2%, according to the Commerce Dept., but that was down from the 15-16% levels seen until about a year ago.
Amazon is releasing Q4/2019 numbers after hours today - look for SCDigest coverage tomorrow.
I have lots more but am out of space. Hope you enjoyed all this.
What is your reaction to the supply chain 2019 in numbers and charts? What would you add? Let us know your thought at the Feedback section below.
|