sc digest
 
August 3, 2018 - Supply Chain Flagship Newsletter
border

This Week in SCDigest

bullet Walmart and Amazon by the Numbers 2018, Part 2 bullet SC Digest On-Target e-Magazine
bullet Supply Chain Graphic & by the Numbers for the Week bullet Distribution Digest
bullet Cartoon Caption Contest Continues bullet Trivia      bullet Feedback
bullet New Expert Insight and Supply Chain by Design bullet On Demand Videocasts
 

NEW REPORT PROVIDED BY SOFTEON


New Report: WMS Cloud is Ready for Prime Time 2018


Lessons Learned from Actual Deployments, as Number
of Cloud WMS Deployments Accelerate


first thought

SUPPLY CHAIN NEWS BITES


Supply Chain Graphic of the Week
Looming Threat to the US Economy?

bullet

Uber Calls it Quits on Self-Driving Trucks

bullet
Levi's Turning Its Blue Jeans Supply Chain Green
bullet
Expanding the Driver Pool
bullet
Economic Good Times Roll On

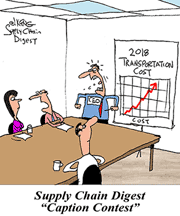
CARTOON CAPTION CONTEST CONTINUES

July 16, 2018 Contest


See The Full Cartoon and Send in Your Entry Today!


Feature Story: US Market for Warehouse Space Remains Red Hot, with Availability at Near Record Lows


ONTARGET e-MAGAZINE
Weekly On-Target Newsletter:
August 1, 2018 Edition


New Cartoon, Expanding Driver Pool. Opioids and Manufacturing, More

eBOOK PROVIDED BY LOGILITY


Using Multi-echelon Inventory Optimization to Achieve Measurable Operational Improvements


NEW EXPERT INSIGHT
BOPIS to the Rescue - Inventory Integrity
by Richard Wilhjelm
Vice President, Sales and Business Development
Compliance Networks

SUPPLY CHAIN BY DESIGN
Putting AI in the Hands of Truckers


by Dr. Michael Watson

EXPERT INSIGHT
The Three "Ps" of Sales & Operations Planning Success


by Henry Canitz
Product Marketing & Business Development Director
Logility

EXPERT INSIGHT
Create A Micro Supply Chain for Each Customer Order


by Martin Verwijmeren
Chief Executive Officer
MP Objects

NEW REPORT PROVIDED BY SOFTEON


TRIVIA QUESTION

Which were the top 5 largest US truckload carriers by revenue in 2017?

Answer Found at the
Bottom of the Page


Walmart and Amazon by the Numbers 2018 Part 2

My column a few weeks ago on Walmart and Amazon by the Numbers 2018 once again proved very popular, with a number of readers emailing "give us more." That response, plus the fact that I have a lot of fun doing this, brings me back this week, with some additional data and charts.

GILMORE SAYS:


62% of Amazon's strong Q2 2018 operating income came from its web services unit, and the folks at the SeekingAlpha web site say on-line store operations are still probably about breakeven.

WHAT DO YOU SAY?

Send us your
Feedback here

I will again quickly note that a few readers commented that my first column alerted them to the fact that you really have to dig into almost any numbers reported by someone to see if they make sense and/or understand what they really mean in context, as for example, in my unique analysis of Amazon's shipping costs as a percent of relevant not total sales. I could write a whole column on this point - take few numbers at pure face value.

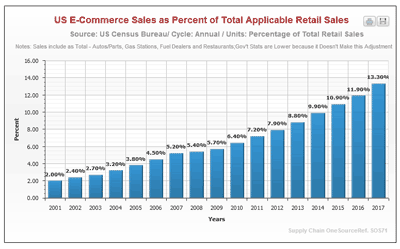
OK, to first put the numbers from both of my columns in perspective, let's first look at the rise of ecommerce. According to the Commerce Dept., ecommerce sales were about 9.5% of total retail sales last year, up from 8.1% in 2016 - but those total retail numbers include sales of cars, gas stations, restaurants and a few other categories that are not really relevant for comparison.

So, we compute the numbers based on the same formula we used in the last column to analyze Walmart's share of US retail, for which we take total retail and subtract out those non-relevant categories. Using that formula, ecommerce sales were a much higher 13.3% of total US retail sales in 2017, up strongly from 11.9% in 2016. Of course, that share is much higher in some product categories, such as electronics and apparel.


See Full Image


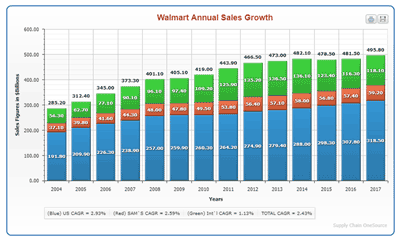
In my first column, we also graphed the annual percentage growth for Walmart's US retail sales, which have slowed noticeably in recent years. Below we show the Walmart numbers in absolute terms across its three reporting units: US, Sam's Club, and International. All units have seen the pace of growth slow sharply, and the recent big slowdown in international is a bit puzzling. Basically, Walmart's total sales are close to flat since 2012.


The cumulative average revenue growth rate (CAGR) for each unit and total sales since 2010 is shown beneath the chart. Walmart has had an average CAGR of a pretty decent 4.46% for total sales from 2004 through 2016, but that clearly came much more from the first half of that period than the last few years. Since 2010, total revenue has grown just 2.43% annually, with international rising just 1.13% per year, and surprisingly the fastest growth in the most mature segment, US retail, at 2.93%, as the law of large numbers is felt company wide. Still the decent 3% total growth in 2017 represents almost $15 billion in new growth - the size of a large retailer on its own.

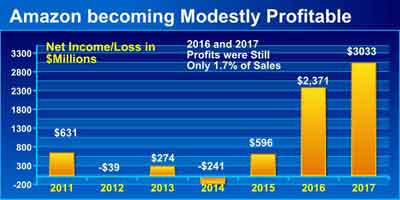
Switching gears, Amazon for years received much criticism for its consistent failure to really make any money, but that started to change in 2016, as can be seen in the chart below. Net income for 2017 was up 28% to a little over $3 billion, though that is still just 1.7% of sales for the second year in a row.


Now you probably heard Amazon had a strong Q2 2018, with profits of $2.5 billion in just one quarter, or 4.7% of its $52.8 billion in sales. However, 62% of its operating income came from its web services unit, and the folks at the SeekingAlpha web site say on-line store operations are still probably about breakeven.


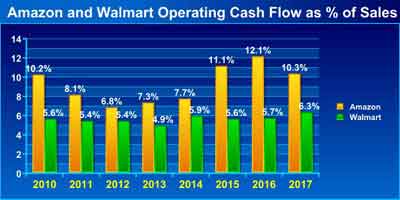
For years some have said to look at Amazon's cash flow from operations instead of profits, which paints a better picture, and indeed operating cash flow has generally had a stronger story than net income. as shown in the chart below. Operating cash flow as a percent of revenue has generally been much higher than at Walmart. Note, however, the consistency of the Walmart numbers, and that it actually saw a nice bump in 2017, while Amazon's number fell.


See Full Image


But there is operating cash flow and then what is called "free cash flow," or operating cash flow minus capital expenditures, and here the story is also interesting.


Amazon had operating cash flow of $18.4 billion in 2017, and had CapEx of about $$11.9 billion, up more than $4 billion from 2016. So that means CapEX was 64% of operating cash flow, way up from from 41% in 2016, though that was something of an aberration.

Walmart, on the other hand, had CapEx of about $10.6 billion - down a bit from 2016 - against $31.6 billion in operating cash flow, or 33%, a much lower percent than Amazon in 2017 after being almost exactly the same ratio as Amazon in 2016. (Note: as a proxy for official CapEx, I am using spending on real estate, equipment and technology). Importantly, Walmart, however, also has to pay a dividend from its cash flow- $6.1 billion worth last year - while Amazon does not. So Amazon's operating cash flow minus CapEx spend = $6.5 billion in 2017 (a big drop from 2016). Doing the same calculation with Walmart but also subtracting the dividend leaves it with $14.9 billion in free cash. That is more than double Amazon's total, but Walmart has nearly three times the revenue. But the dividend factor is huge and a giant advantage for Amazon.

In the first column I lamented that Amazon now only provides total shipping costs, not net costs including shipping revenues as it did for years. It also stopped reporting merchandise sales, which I used as the denominator for several ratios, as the best approximation for product sales that require fulfillment and shipping activities.


So I had to improvise, and used what Amazon reports as sales from "on-line stores," then added revenues from what Amazon calls third-party services. That latter number includes commissions the company gets from its marketplace sellers, and revenues from Amazon's third-party logistics services, including Fulfilled by Amazon (FBA). With that number as the denominator, shipping costs in Q4 2017 were 16.1% of relevant revenues - but the number is less meaningful without knowing the net costs.

So I also have been tracking to fulfillment costs for years- basically DC operations plus the depreciation expense for all those buildings and robots, plus inbound freight. Fulfillment costs are reported as a line item by Amazon. Until this year I calculated the ratio of that expense - which doesn't include shipping, by the way - again against merchandise sales. But now I have to do it against my new denominator. By that calculation Q4 2017 fulfillment costs were a whopping 54.6% of my combined relevant number - though it is not as clear what the state of affairs truly is with the new reporting.

I could do more, but think that's enough for awhile - unless convinced otherwise. And next year I will add Alibaba to the mix.

Any reaction to these numbers from Amazon and Walmart? Any other data you would like to see? Let us know your thoughts at the Feedback button or section below.


On Demand Videocast:

Digitizing the Order Management Process


Orders Still come in Many Different Forms and Systems - Here's How to Get them Under Digital Control

This videocast discusses breaks down all the ways in which orders can arrive, the downstream challenges associated with each, and the benefits of digitization.


Featuring Dan Gilmore, Editor along with Esker's Sarah Joiner.

Now Available On Demand

On Demand Videocast:

Reducing Costs through Automated Inventory Replenishment & Analytics


How Motor City Industrial Taps into Data Visualization to Help Customers Identify Waste, Reduce Inventory


This videocast discusses how to connect people, processes and technology across commerce and supply chain operations to achieve unified commerce.


Featuring Dan Gilmore, Editor along with Joseph Stephens, CEO, Motor City Industrial, Jay Fielder, Supply Chain Technology Manager, Motor City Industrial and Mike Wills, Chief Revenue Officer, Apex Supply Chain Technologies.


Now Available On Demand

On Demand Videocast:

Yes, Retailers and Distributors Can Survive and Thrive by Unifying Commerce and Supply Chain

Integrated Approach will Improve Customer Experience as Smart Retailers Move Beyond Omnichannel

This videocast discusses how to connect people, processes and technology across commerce and supply chain operations to achieve unified commerce.


Featuring Dan Gilmore, Editor and enVista CEO Jim Barnes, a highly recognized industry expert on retail and distribution.

Now Available On Demand

YOUR FEEDBACK

We are way behind on Feedback. Catching up on some email here.

Feedback on a New Way to Think about Gartner and the Top Supply Chains:

comma

Excellent article, thank you for your analysis. Whenever I see a comparison or rankings of this nature it makes me think, who's raising the question (who cares) and why?


Beyond obvious bragging rights does an analysis of this nature equate to a higher stock price? Do underwriters give more favorable rates or increase the scope of coverage? Does the CEO use the analysis as a way to communicate to shareholders that the organization is achieving a greater return on invested capital? Or for a Risk Manager does it mean that the higher ranking organizations will be able to better manage (or exploit) "black swan" events?


If we move away from the operational performance metrics, does a higher ranking equate to greater difficulty for disrupters or new entrants to enter the market? Does the ranking equate to greater financial leverage over suppliers or the customer (a greater willingness to pay)? Does the ranking reflect overall speed of execution in the market, i.e. not just inventory turns but an ability to exploit an opportunity?


Dan, I think your article brought to light the elephant in the room and a question many think but don't ask. As a former Gartner Research Director I am very aware of "the process" and the purpose for these studies. Gartner's value is it's directional research. They are also in the marketing business and must create hype, community and competition. Studies (and conferences, research notes, special research projects) do exactly that! This is about the benefit to Gartner and their ability to drive business.

Of course, they are not alone and I don't mean to infer that they act alone. Bottom line: until the "who asking the question" and "why" are the motivated to address such a question, then studies of this nature are limited to entertainment value.


Gary S. Lynch
CEO and Founder
The Risk Project, LLC


Feedback on Home Depot and the Arc of Supply Chains:


comma


Excellent story. For supply chain to be a competitive advantage, dynamic operating model approach is a must. You got to pro-actively understand (I mean, really understand...) your customers and shape the operations/supplychain to provide a personalised, meaningful and profitable customer experience... Little bit of tinkering here and there just doesn't cut it.


You can sweat your assets only so much. If the alignment is fundamentally flawed, you will only create stress... And on a different angle, endless personalisation won't get you far.


Vikram K Singla
Oracle


Feedback on Gartner Conference:


comma


Picking up on your report on what Anthony Bourke was saying and your comment reminded me of a 30 minute meeting I started holding with my logistics team every Friday just before lunch. I asked each one to select something that had gone right that week and to flag up one that had gone wrong. I then asked them to report on one concern about what might go wrong the following week.


It certainly concentrated minds and after a relatively short while brought through a great deal more collaboration and made a major contribution to improved customer service and cost control.


David MacLeod
Learn Logistics Limited

comma

An excellent round up of the proceedings. I particularly liked the way you covered Fareed Zakaria's observations on the threats of increasing digitization. It was great reading through your summary. Thanks indeed.

Krishnan


comma


SUPPLY CHAIN TRIVIA ANSWER

Q: Which were the top 5 largest US truckload carriers by revenue in 2017?

A: (1) Knight-Swift Transportation; (2) Schneider; (3) Landstar; (4) JB Hunt; (5) TFI International, according to the new Transport Topics list.

© SupplyChainDigest™ 2003-2018. All Rights Reserved.
SupplyChainDigest
PO Box 714
Springboro, Ohio 45066
POWERED BY: XDIMENSION