sc digest
 
December 5, 2014 - Supply Chain Flagship Newsletter
border

This Week in SCDigest

bullet What Would You Tell Accountants about Supply Chain? Part 2 bullet SC Digest On-Target e-Magazine
bullet Supply Chain Graphic & By the Numbers for the Week bullet Holste's Blog/Distribution Digest
bullet Cartoon Caption Contest Winner Announced bullet Trivia      bullet Feedback
bullet New Stifel Transportation Weekly and New Supply Chain by Design bullet New Videocast/On Demand Videocasts
FEATURED SPONSOR: COMPLIANCE NETWORKS
   
 
FREE Calculator: Inbound Shipping Variability
Impact on Expensive Safety Stock


first thought

SUPPLY CHAIN NEWS BITES

Supply Chain Graphic of the Week:

A Look at Oil Prices as Current Costs Plummet

bullet
Amazon.com Aggressively Rolling Out the Robots
bullet
US Manufacturing Wages Falling
bullet
How Low Can Oil Go?
bullet
Is Walmart Getting Price Duped?
 

CARTOON CAPTION
CONTEST WINNER ANNOUNCED

November 4, 2014 Contest


See Who Took Home the Prize!

 
Holste's Blog: Vertical Lift Modules and Vertical Carousels Provide High Density Storage in a Small Footprint

FREE CALCULATOR AVAILABLE FROM COMPLIANCE NETWORKS


FREE Calculator: Inbound Shipping Variability Impact on Expensive Safety Stock


ONTARGET e-MAGAZINE

Weekly On-Target Newsletter:
December 3, 2014 Edition


Last Chance Cartoon, Wide Area RFID, Cool Product , Vertical Lift Modules and more

NEW STIFEL TRANSPORTATION WEEKLY
Stifel Transportation Weekly for Nov. 24, 2014


by John Larkin
Managing Director and Head of Transportation Capital Markets Research
Stifel Financial Corp

NEW SUPPLY CHAIN BY DESIGN
Calculating Supplier Lead-Time Variability: Not as Easy as It Seems


by Dr. Michael Watson

KEEP IT MOVING
What Economic Impact Will the Amazon Sortation Network Have on UPS and FedEx?


by Marc Wulfraat
President
MWPVL International, Inc.

SUPPLY CHAIN TRIVIA

What important supply chain and enterprise metric is calculated as: Days Inventory Outstanding + Days Sales Outstanding - Days Payables Outstanding?


Answer Found at the
Bottom of the Page


What Would You Tell Accountants about Supply Chain? Part 2

A couple of weeks ago, I began a summary of a presentation I gave to an audience of accountants in Orlando at a meeting of large tax and audit firm BD0. It turned out to be quite popular and drew a number of reader comments. See What to Tell Accountants about Supply Chain?

My somewhat vague mission in Orlando was to identify the current supply chain issues and trends that were important to CXOs, so that BDO consultants would be better informed generally and able to look for opportunities to perhaps help their clients in this area.


So, as described in part 1, I started by defining what a supply chain is, in part using the SCOR model, but adding that the image showing the Plan, Source, Make, Deliver and Return processes with the three key flows of the supply chain (material, information and cash) came across in too linear a fashion. It was really more of a supply chain "web" than the picture might suggest.


GILMORE SAYS:

"With this perfect network, Unilever would have logistics costs equal to just 55% of what it actually spent, and was able to identify all the different things (operational inefficiency, costs to meet extra customer requests, etc.) that accounted for the other 45%. "

WHAT DO YOU SAY?

Send us your
Feedback here

I next thought it made sense to connect the supply chain to shareholder value, starting with a quick review of the famous DuPont financial model, and the role of supply chain in impacting that formula.

That was followed a summary of related insight developed by a man named Gerry Marsh, who has shown how two companies in the same sector with similar earnings and growth rates can have very different stock multiples, because one of the two throws off a lot more cash from its revenue. Of course, the supply chain is a key driver of operating cash flow generation.

So with that, I moved next to a series of key supply chain issues that I thought would likely most connect with their work. I considered but in the end did not address the "tax efficient" supply chain, in part because like most I am no expert, even though I do believe there are some real opportunities here if you can manage an iterative process of operational and tax-aware supply chain network design.

I started by noting that in terms of inventory levels, frankly we seem to have stalled. The annual REL working capital data, which we analyze, has shown corporate inventory levels rising in recent years, albeit very modestly. Our analysis by sector has shown very little progress over the past decade in most of them.

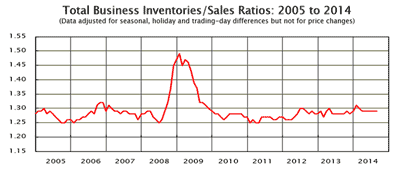
The graphic below charts the inventory-to-sales ratio, as tracked by the US government, measuring on-hand inventory levels against one month's worth of sales. As can be seen, other than the wild gyration in 2008-09 associated with the great recession, inventory levels have in fact been flat for a decade, even gently rising in the past few years. That despite lots of efforts to attack inventory, much technology spend to do so, etc.


See Full Image


Why is that? More on this someday soon, but I cited several factors: a general bias in the last few years towards top line revenue growth, relatedly SKU proliferation and new product introductions, and longer offshore supply chains. But more provocatively, I suggest many companies may have simply hit an inventory wall within the context of their current supply chain designs.

Next, I talked about the imperative to map and model a company's supply chain. The mapping took on extra urgency after the events of 2012 - earthquake and tsunami in Japan and massive flooding in Thailand, which caused huge supply chain disruptions. Shortly thereafter, a Toyota executive noted: "Our assumption that we had a total grip on our supply chain proved to be an illusion."

Mapping your supply chain down multiple levels is a massive job - but essential to understand and ultimately mitigate supply chain risk. The Japan incidence, for example, highlighted how often dual sourcing was not as risk free as thought if both suppliers are located in the same geographic area. Ditto with two or three suppliers for a given item which are all dependent on s single vendor for some key component or material.

That connects in a sense to building an on-going model of your supply chain that can be used to make both strategic and more tactical supply chain decisions. Companies that do such modeling in my opinion have a huge advantage over those that do not. I had a lot more to say on this, but will save that for some other day.

Next up: supply chain metrics. As I have said before here, most companies have KPIs out the wazoo today, and tracking performance against those metrics has become very sophisticated. My belief is that most supply chains generally hit their metrics most of the time.

Yet, study after study seems to show a wide disparity in supply chain performance. How can this be, given what I noted above? There must be at least one of three causes: (1) too many companies are being rigorous around the wrong metrics; companies are hitting their metrics, but they are the wrong measures; (2) the right metrics are largely in place, but the targets are set at the wrong levels; or (3) SCM performance is limited by the existing network design, to reiterate a point made above.

I think it is largely factors 2 and 3.

To the last point, I told the fascinating story we recounted earlier this year of how Unilever was able to define a "perfect logistics network," where all plants carried all products, everything went out on a full truckloads, operations went perfectly according to plan, etc. With this perfect network, Unilever would have logistics costs equal to just 55% of what it actually spent, and was able to identify all the different things (operational inefficiency, costs to meet extra customer requests, etc.) that accounted for the other 45%.

Next up was the wave towards Cloud-based software, and my belief it will soon come to dominate the landscape. I covered the usual ground of noting the pros and cons of Cloud versus traditional, and then made the point I offered just a few weeks ago here that companies should think along these lines: the net present value of the costs over some period (e.g., 5 or 7 years) should be the same whether you pay for an upfront license and maintenance or go the subscription/transaction route. This seemed to go over well with the accountants.

Finally (at least for here - I covered a couple of more things in Orlando) I took a look at risk management - still a very hot topic.

There is the traditional approach of a 2 x 2 matrix, with the dimensions of likelihood of occurrence (high/low) and size of impact from a given event/disruption. Some have taken this to a 3 x 3 approach to add a middle ground.

I've seen some companies add some intelligence with colors in the matrix approach to identify the speed at which an event would cause a major disruption, which is a nice touch. But I then presented Dr. David Simchi-Levi's new Risk Exposure Index (REI), which really for the first time quantifies supply chain risk by calculating "time to recovery" and then the resulting "financial impact" from a disruption. Totaling these together can quantify the full supply chain risk - very good thinking.

By the way, the REI has been updated/enhanced - look for a Videocast on this topic from SCDigest very soon.

I think I connected with the accounting audience, though you can never be sure. The good news is I realized this is all just as relevant for regular supply chain folks too, so I will carry it forward elsewhere in 2015 as well, starting with the Toronto CSCMP chapter early next year.

What would you tell accountants about supply chain? Any reaction to what Gilmore presented? Let us know your thoughts at the Feedback button (email) or section (web form) below.


View Web/Printable Version of this Column
   

Townhall Meeting:


Townhall Meeting! Is Flowcasting Really a Game Changer in the Consumer Goods to Retail Supply Chain?


Claim is that Store-Level DRP and New Approach to Forecasting Deliver Big Gains - Does It Stack Up?


Featuring
Andre Martin , Flowcasting Inventor, JDA Software, Kevin Smith of DePaul University, Parag Jategaonkar of Accenture and Fred Baumann of JDA Software.

Tuesday, Dec. 16, 2014

New On Demand Videocast:


Why Now Is the Time to Close the 3PL "IT Gap"


How Leading Logistics Service Providers Can Move to the Next Level of Technology Enablement to Win New Business and Get More Strategic with Clients

Featuring
Gene Tyndall, former VP of Supply Chain Solutions at Ryder, SCDigest's Dan Gilmore, and Todd Johnson of JDA Software.


Now Available On Demand

On Demand Videocast:


The Impact of Vendor Lead Times and Variability on Inventory Levels


Introducing the New Lead Time/Inventory Level Calculator!


Featuring
Mark Krupnik of Retalon, Kevin Harris of Compliance Networks and SCDigest editor Dan Gilmore.


Now Available On Demand

YOUR FEEDBACK

Catching up with some feedback from some First Thoughts columns over the past few weeks.

That includes an outstanding email that's our Feedback of the Week on our First Thought column on The Coming US Logistics Cost Crack-Up? from long-time transportation sector executive David Goodson.

It is detailed and long enough we will just let it stand on its own - good insight.

Feedback on Logistics Cost Crack-Up:

comma

While I have no doubt logistics costs are going up, a 22 percent increase is doubtful. Any significant price increase will force shippers to change practices to help carrier mitigate cost increases. Also, if rates go up substantially, expect more capacity to enter the market to bring supply and demand in line. However, it takes 1-2 years for additional capacity to come into the market, so there could be some eye-popping rate increases in the short term, which will recede over time.

The article did raise some interesting points worth commenting on, and I will end with my own prediction of cost increases.

$70,000 pay for drivers is not needed to solve the truckload carrier driver shortage. This is the level of pay needed to attract the quality of driver carriers' wish they had. Moaning about how driver use to be is a staple of conversation in the trucking industry. If an average wage of $46,000 attracts enough drivers to result in at most a 5% shortage of drivers, than a 20% increase to $55,200 would surely produce enough additional drivers to fill all the trucks. We are probably looking at a 10-20% increase once demand heats up.

So far as I know, private fleets and local trucking operations don't have as much of a problem attracting drivers as truckload carriers. Still, if truckload wages go up, the increase will ripple into non-truckload carriers. So no fleet is immune.

Werner raising wages 14% means little as they have always lagged the industry in pay rates. A long time ago they adopted a high driver turnover model of training students and then paying them a low wage rate for the first few years. Most fleets used to require 3 years of over the road experience, so the students were somewhat stuck. Now carriers are only requiring six months experience, so I suspect that Werner was having trouble-keeping students long enough to make the cost of training worthwhile and is now seeking experienced driver hires.

The Teamsters are not going to organize any mega fleets in our lifetime with the exception of FedEx. After bankrupting almost all for-hire union carriers, the teamsters have never organized anyone of significance. Trucking companies who employ owner operators such as Swift, lease those drivers in states with the most favorable laws to minimize the risk of contractors ever being deemed employees. Long Beach is an exception to that rule, but drayage costs are a very small component of overall logistics costs.

The only healthy mega carrier where Teamster labor is the dominant force is UPS. So the Teamster dream of getting the other half of the small package duopoly organized. However, there have always been thousands of employees drivers at FedEx the Teamsters could have organized a long time ago, so I doubt their ability to do so now. Even if it occurred, UPS and FedEx are already jacking up rates as fast as the market will bear. So it is hard to make a case that rates will go up any faster if they both operate under the same labor contracts.

A carbon tax has no chance of passing congress. While Obama has pushed the limits of what a president can do through executive orders, he still cannot order new taxes. On the flip side, a president who promotes domestic oil production could dramatically bring down fuel costs. As most rates are still tied to a fuel surcharge, lower fuel costs will automatically result in logistics costs going down. This is one of the mitigating factors I mentioned, as a 22 percent increase in logistics costs would have shippers screaming to congress for relief, and fuel costs are the obvious place to start.

Electronic logging will have a much bigger impact that 2%. (I really don't know how any trucking company could detect a 2% change in productivity due to single factor.) Paper logging has always been the fudge factor that mitigates the loss in productivity of new regulations.

Example, if a driver sleeps overnight in a customer yard, an electronic logger starts the 11 hours driving cycle when he moves the truck to the dock. With a paper log, he probably wouldn't log driving until he leaves the shipper gate, a lost of at least a 1/2 hour of driving time. Fueling, a 20-minute activity is now counted against the 11 hours of driving time. If the driver is on an overnight run, he is going to want to bed down at least a 1/2 hour before the 11 hours are up as there is no wiggle room for error with an electronic logger. No matter how efficient shippers and carrier become, it is hard to mitigate productivity losses like these.

My guess is a 10% loss of for-hire capacity not currently electronically logging and not receiving a local terminal exception. If 1/2 of for-hire trucking capacity falls into this definition, than I expect a 5% capacity loss, which will lead to a short term spike in truckload rates. If you think I am overstating the case, you haven't been around enough over the road drivers.

As truckload drivers are paid per mile, lost miles due to the decrease in driving hours will force a 10% wage increase just to maintain a $46,000 average driver wage. Factor in another 10-20% to fill all trucks we are looking at wage increase of 20-30%. If driver labor represents 41% of logistics cost, we are looking at a 8-12% increase. That is probably the worse case, and only for heavy truckload shippers.

Even at the lowest level, I would not want to be one trying to justify an 8% increase to a CFO. When fuel drives logistics cost up, it is fairly easy to explain why to anyone who recently filled a car's tank. You cannot quickly explain to anyone why going to paperless logs has increase costs, not lower them.


David Goodson


comma


SUPPLY CHAIN TRIVIA ANSWER

Q: What important supply chain and enterprise metric is calculated as: Days Inventory Outstanding + Days Sales Outstanding – Days Payables Outstanding?

A: The "Cash to Cash" cycle.

© SupplyChainDigest™ 2003-2014. All Rights Reserved.
SupplyChainDigest
PO Box 714
Springboro, Ohio 45066
POWERED BY: XDIMENSION