 |
July 24, 2014 - Supply Chain Flagship Newsletter |
 |
Second MIT-SCDigest Study on US Manufacturing 2014 Is the Reshoring Trend Real? How has Thinking Changed Since 2012? |
|
|
If you PARTICIPATED and COMPLETED the 2012 Re-shoring Survey: |
 |
|
|
|
 |
|
||||||||||||||||||||||||||||||||||||||||||||||||||||||||||||||||||||||||||||||||||
Insights from Unilever's Perfect Logistics Network Exercise
|
|||||||||||||||||||||||||||||||||||||||||||||||||||||||||||||||||||||||||||||||||||
| GILMORE SAYS: |
"I think the Unilever approach was very innovative,
not dissimilar to an unconstrained network analysis but with a
different goal and thus result." WHAT DO YOU SAY? |
Is it true? I don't think anyone really knows. I have asked several of the best minds in supply chain network design (Mike Watson of Northwestern, David Simchi-Levi of MIT, Tony Brzoznowski of LLamasoft, Jeff Karrenbauer of Insight, etc.) whether they believe this statement to be true, and all have said they aren't really sure. Several of them have said they would be interested in looking at this question more closely.
All that as a preamble to one of the more interesting conference presentations I have seen lately, from Matt Algar of Unilever, at the recent LLamasoft user conference in Ann Arbor, MI.
I believe it sheds some bright light on this very question.
I attended the session based on its title of "Defining the Perfect Logistics Network," interesting on its own right, but especially relevant for me based on some thinking I have shared on the coming era of what I call perfect logistics. The presentation turned out different than I expected - but was compelling nevertheless.
Algar made the initial point that as in virtually every company, each year the Unilever logistics organization was given targets from the top relative to cost reductions for the coming year. But he said, did anyone really have the context or understanding to know whether those targets made sense? And while Unilever generally found a way to hit those targets, did it sometimes do so at the expense of other areas less closely measured, or achieve the short term goals while doing some damage to the mid- or long-term strategies?
These I think are very interesting, important and near universal questions. How to address them?
These issues somehow led Unilever to ask deeper questions about what comprised and drove its total logistics costs. And the starting point was this: what would its logistics costs be if it in fact had a "perfect" US network? And if it could determine that, how then could it explain the delta between what those perfect network costs would be and what it actually spent?
I have certainly heard of many companies doing "unconstrained" supply chain network designs at the start of a project, but never quite in the way Unilever went at it here.
So using the LLamasoft network design tool, Unilever proceeded to answer those questions. It started by calculating what its logistics costs would be in a perfect logistics network, where all plants could make all products, everything went out in a full truckload from manufacturing sites, there were never any expediting costs, etc. It also involved benchmarking what the best market rates for transportation would be in such a network.
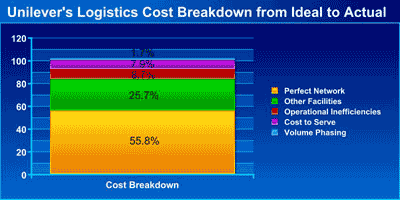
That ideal network, it turned out, would operate at logistics costs equal to just 55.8% of the current spend.
So, how to explain the other 44.2% of costs? Unilever then nicely segmented those out by category:
• Costs of from its actual physical network of DCs and third party co-packers (logistics costs only): 25.7% of the total
• Operational inefficiencies, include transportation mix deviation from the perfect model: 8.78%
• Customer "Cost to Service" (accessorial charges from customer deliveries, orders that caused extra logistics costs, etc.): 7.98%
• Volume phasing (production/shipping volumes fluctuate, causing overtime, end of period inefficiency, etc.): 1.66%.
This is shown in the chart below (SCDigest re-creation from presentation data):

I hope the merit of all this is clear. Unilever was able to attain a much deeper understanding of what drove its logistics costs, and pinpoint the true impact of inefficiencies. It allowed a much more informed and intelligent approach to setting cost reduction targets. It provided great insight to help with the effort to reconfigure its existing network towards a more optimal one. And it would provide much greater clarity in making trade-off decisions, such as between manufacturing and logistics costs.
It also in the end changed the mindset within Unilever.
"We saw that logistics savings would need to shift from tactical operating efficiencies to strategic changes in customer terms of sale, manufacturing profiles, and distribution," Algar said.
Brzoznowski recently told me that "This approach helps show supply chain and corporate leaders how far their current operations are from optimal." I think that would be eye opening for many companies.
The aforementioned Mike Watson, who writes our "Supply Chain by Design" column, noted that generally, the first step in a network design project is to build a model that can explain/predict current logistics costs. Next, he says, you build an "optimized baseline," where you apply all the rules that should have been followed but often aren't, to see what costs should have been.
"The Unilever team took this idea a step further - they came up with a nice extension to the idea of the optimized baseline," Watson recently wrote for us. "They asked questions like what if every product could be made everywhere, what if every part was transported as if it were on a full truck, and what if everything traveled on the ground vs air."
So, I think the Unilever approach was very innovative, not dissimilar to an unconstrained network analysis but with a different goal and thus result. I think many if not all would benefit from doing this kind of analysis.
By the way, Unilever has started to do this same program in other geographies, and found the cost breakdown - from the ideal network costs as a percent of current spend to the percents in each of the "inefficiencies" buckets, varies significantly.
So, with that last thought, I circle back to the issue of how much of a supply chain's cost is "locked in" by the network design. Does this Unilever exercise provide any insight into that question?
Indeed it does. In its case, the network costs locked in are a combination of the ideal costs (55.8%) plus the costs of the network it really operates (25.7%) - for a total of 81.5%. The only costs that could be attacked from operational improvements, if you will, are in the other three categories, equaling just 18.5% of the total. Conversely, it has a 25.7% opportunity from improved network design. That is very interesting indeed.
Those numbers will be different for all, of course, but it looks like the PRTM guy or whoever it was may just have been right.
What is your reaction to Unilever's perfect network exercise? Do you agree it sheds light on how a network locks in costs? Let us know your thoughts at the Feedback section below.
![]()
| View Web/Printable Version of this Column |
|
|
|
YOUR FEEDBACK
Just catching up on some miscellaneous feedback in recent weeks. Enjoy.
Feedback on the Ocean Container Alliance Concept:
Back in the days, others have pursued the same route, but were not successful and went out business, for example, mid 80s alliance, between Inco-Trans, CGM, and Happag Lloyd. Just a quick glance at the trans-Atlantic trade, not many carriers are out there anymore. I still firmly believe that innovative techniques in ships operations, routings, rates, among other areas are needed most in this advanced global market. Innovations add value and enhance the financial results. Innovations help gain competitive advantage and sustainability. I am not sure if alliances are the solution to current issues and problems, rather it should be more advanced and new ideas to serve better and move forward to the next level. We need to run more serious and productive studies on the shipping sector in order to find out exactly what could be done to save the shipping business from disappearing all together from the market. Rafik Labib
|
||
| On Walmart Truck Accident and HOS Reform: | ||
Yes I really think that this accident will put a hold on the 34 hour reset rule change because the rule makers just want what they want. They haven't even conducted a proper study on how this new rule affects the trucking industry. Since the new rules have been in place I have seen a spike in truck crashes. These so called electronic log devices force drivers to drive fatigued. I will give a perfect example: if I wake up from a 10 hour rest break in the morning and I'm well rested ready to go and my next load isn't ready to go and in some cases I may not have a load at all, I will have to sit all day waiting. Now remember, I just had 10 hours of rest and I'm ready to roll. With me sitting all day waiting eventually I'm going to get tired, so now I'm faced with two options 1. Drive tired when I finally have a load after sitting all day waiting; or 2. Turn the load down and make no money at all. These so called law makers don't have a clue about trucking it seems to me they just want to make things more complicated and put more stress on drivers which will lead to more crashes. Due to these changes there is more traffic on the roads and more accidents because drivers are pushing it to the limit to beat the clock whether its making a delivery on time or trying to find a legal place to park for the night. These new rules don't make the roads safer. Give it time and you will see crash ratings go up. Anthony Payne |
||
On Lean versus Agile: |
||
I found this article very interesting, especially as I am a PhD student researching the same topic.
Safaa Sindi PhD Research Scholar Economic Policy and International Supply Chain Automation Plymouth Business School
|
||
|
||
SUPPLY CHAIN TRIVIA ANSWER
Q: By how much are US truckload rates up since 2005, the baseline year of the Cass Truckload Linehaul Index?
A: 19% - as of the June index reading of 119.1, a bit below the all-time high of 121.3 in April. That is roughly an annual average growth rate of just 2% - you can’t exactly calculate the number because we are in mid-year.
| © SupplyChainDigest™ 2003-2014. All Rights Reserved. SupplyChainDigest PO Box 714 Springboro, Ohio 45066 |
POWERED BY: XDIMENSION
|


