As long time readers know, every couple of years I write a piece (this will be the third) on what I call “the 50% problem.” Summarizing succinctly, the 50% problem is this:
Companies consistently tend, often dramatically, to overrate their supply chain performance. While statistically, by definition, half of all companies must be in the bottom 50% of performance in any given area, ask a group of companies where they stand, and almost inevitably, nearly every one of them thinks they are performing
Gilmore Says:
|
|
"Recognize that almost everyone is in the bottom half of performance in at least some areas of the supply chain and, by definition, 50% of companies are overall."
What do you say? |
|
Send us
your Feedback here |
|
better than their peers. Generally, in my experience, a huge percentage of companies believe they are in the top quartile (25%) or quintile (20%) of supply chain performance.
But 75 or 80 percent of them are wrong.
Think I am exaggerating?
What triggered this biennial column is the latest Trends and Issues in Transportation and Logistics report from my friends Drs. Karl Manrodt of Georgia Southern and Mary Holcomb from the University of Tennessee, along with various sponsors. There, amidst other survey data, was this interesting chart:
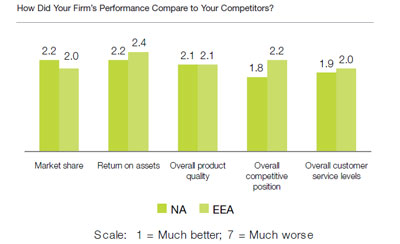
The point I hope should be obvious: the mean/average response from companies rating themselves against the competition across all four of these categories, on a scale of 1-7, is right around 2.0; whereas, in fact, the mean ought to be around 3.5. If it was 3.2 or something, I would say fine, but from a statistical perspective (and this report has 800+ survey respondents), average scores near 2.0 are simply totally out of whack. Like the parents of the children in Garrison Keillor’s Lake Woebegone, everyone believes they are well above average.
In the past, when I have written on this topic, the level of pushback I get is surprising. Here are common arguments that I have heard:
- A general rejection of the observation just because some people don’t like the ramifications; they just don’t want to talk about it;
- The difference between the top and the bottom is very small, so that makes it seem like everyone is near the top; and
- Of course everyone thinks they are doing a great job, what would you expect?
None of that masks the reality. Even though by definition half of all companies must be in the bottom half of performance, I wanted to dig up more proof. In doing so, I spoke with Bruce Tompkins of Tompkins Associates, who runs the company’s Supply Chain Benchmarking Consortium, and I asked him to look up some data from the consortium’s substantial database. Two points:
First, the Consortium’s data consistently supports the fact that there is almost always a “bell curve” of performance. According to Tompkins, “I took 5 metrics of supply chain performance [logistic costs as percent of sales, inventory turns, etc.] and analyzed the data from a statistical view. I arranged the values in ascending order and then determined the min, mean, median, Q1 through Q4, max and standard deviation, as well as 95% confidence interval around the mean,” he said. "Basically, it tells us that the data follows pretty closely to a normal distribution with some outliers that skew the data one way or the other."
In other words, there is a traditional bell curve, and big differences between the leaders and the laggards.
Ah, you say, but “Maybe that is just the difference between different industries. Within a given industry, the differences in performance aren’t very meaningful.”
Not true, says Tompkins, after I asked him to look at it that way. While the standard deviation among responses within an industry does, as expected, come down a bit from the general pool, the difference between leaders, the middle and laggards is still substantial even within industry sectors metric after metric.
Second, Tompkins has also seen the 50% problem play out many times in the Consortium’s work.
“We actually still have a couple of questions in our database where we ask people to rate their companies performance in different areas against others and typically tell them to normalize their perception on volume or revenue or some sizing metric,” he told me. “It always comes back highly skewed to the positive. An example: How do you view your parcel discounts compared to other companies with similar parcel spends? The data for that kind of questions is skewed significantly toward much better discounts or significantly better discounts because they have no idea what the real answer is. We then ask them to tell us what their parcel discounts are for some key parcel types and their perceptions are no where close to reality.”
In other words, when the analysis is based on actual data, there is inevitably a bell curve, and a fairly wide distribution of real performance. However, when the response is based on perception, most companies suddenly cluster near the top of the rankings.
Here is another example, a chart the folks over at another benchmarking service, AQPC, were kind enough to send along to us, showing average “dock to stock” time for a group of several dozen retailers and wholesalers (click here to view chart).
The chart again shows wide variation between the best and worst on this metric. The leaders (top quartile) get it done in two hours; the middle, about six hours, and the laggards - 24 hours. Big differences between tops and bottoms.
I suppose another pushback to my thesis might be: everyone is different. In other words, there is something about those in the bottom half that makes that performance OK for them. Maybe they are doing the best job they can given some strategy or constraint.
Fine, but don’t confuse that with top level performance in the way I think most of us think about it. That leads to being content with performance that is, in fact, well below best-in-class or maybe even the middle, even if that performance can be rationalized based on some other factors.
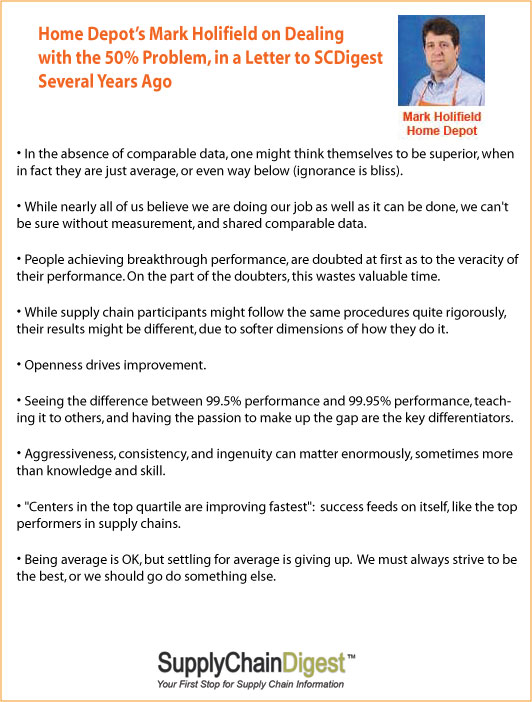
Several years ago, when we first wrote about this, Mark Holifield, then head of supply chain for Office Depot and now in that role for Home Depot, wrote back in response with a great set of observations. We don’t have room in the column, but they are worth repeating, and you can find them here: Holifield on 50% Problem.
For me, I will add to that what I have said before:
- Recognize almost everyone is in the bottom half of performance in at least some areas of the supply chain and, by definition, 50% of companies are overall. This could mean you. Know where you need attention.
- Build consistent benchmarking and self-assessment into your operating model.
- Don’t fire the messengers who suggest such an assessment, only to lead to the unpleasant discovery that what you thought was an "A” or a “B" is really a "D."
I will note in closing that one benchmarking service told me a few years ago that their data had an upward bias, because a large percentage of laggards each year dropped out the next. Who wants to participate in something that shows you to be behind the leaders?
Now that’s a real 50% problem.
What are your thoughts on “The 50% Problem?” Have you seen it in action? What could you add to Mark Holifield and Dan Gilmore’s suggestions? What has your company done?
Let us know your thoughts.
Web Page/Printable Version of Column
|


 The Top 3 Reasons
 QUESTION:
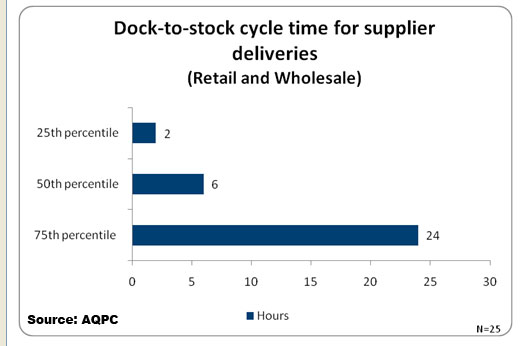