My column a couple of weeks ago on Walmart and Amazon by the Numbers proved very popular, with a number of readers emailing "give us more." That response, plus the fact that I have a lot of fun doing this, brings me back this week with some additional data and charts.
I will quickly note that a few readers commented that my first column alerted them to the fact that you really have to dig into almost any numbers reported by someone to see if they make sense and/or understand what they really mean.
This is absolutely true, and I could give you many examples, but an easy one is the monthly numbers from the Federal Reserve on US industrial output. The number might spike say in July, generating glowing economic headlines. But if you look at the data closely it might have been because total industrial output includes utilities (and mining), and the jump might have been due to a very hot month in which everyone was cranking up the AC. SCDigest always just looks at the manufacturing numbers, for a better view of the real economy.
Ok, to put the numbers from both columns in perspective, let's first look at the rise of ecommerce. According to the Commerce Dept., ecommerce sales were about 6.5% of total retail sales last year - but total retail includes sales of cars, gas stations, and a few other categories that are not really relevant for comparison.
So, we compute the numbers based on the same formula we used last time to analyze Walmart's share of US retail, for which we take total retail and subtract out cars, parts, gas stations, fuel dealers and restaurants. Using that formula, ecommerce sales were a much higher 9.9% of total retail sales in 2014, up strongly from 8.8% in 2013. Of course, that share is much higher in some product categories, such as electronics and apparel.
Last time, we also graphed the annual percentage growth for Walmart's US retail sales, which have slowed noticeably in recent years. Below we show the Walmart numbers in absolute terms across its three reporting units: US, Sam's Club, and International. All units have seen the pace of growth slow, and the recent big slowdown in international is a bit puzzling.
The cumulative average growth rate (CAGR) for each unit and total sales is shown beneath the chart. it shows an average CAGR of a pretty decent 4.8% for total sales from 2004 through 2014, but that comes much more from the first half of that period than the last few years for sure.
Switching gears, Amazon get much criticism for its consistent failure to really make any money, though it eked out a small profit in Q4 after small losses the rest of 2014. But others say look instead at Amazon's cash flow from operations, which paints a better picture, and indeed operating cash flow is higher as a percent of revenue than Walmart's of late, as shown in the chart below. Note the consistency of the Walmart numbers.
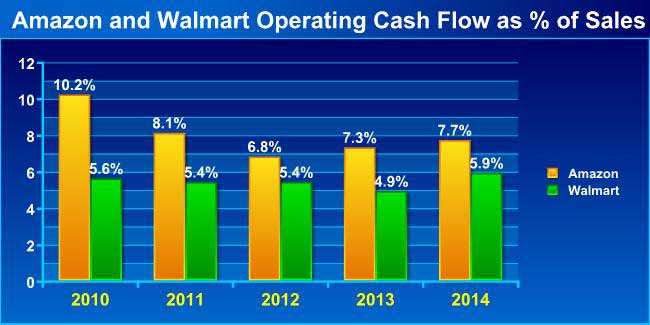
But there is operating cash flow and what is called "free cash flow." The latter equals operating cash flow minus capital expenditures, and here is where Amazon's spending habits kick in. While Amazon had operating cash flow of $6.8 billion in 2014, it had Capex of….. $4.89 billion, or a whopping 72% of operating cash flow.
Walmart, on the other hand, had Capex of about $12 billion against $28.5 billion in operating cash flow, or just 42%. (You could look at this other ways, such as deducting gains on assets sold during the year from the Capex spend to get a net total, but my numbers tell the story as is). Walmart also has to pay a dividend - $6.1 billion worth last year - while Amazon does not, meaning Amazon can get away with spending more on fulfillment centers without that burden.
Ok, finally I previously calculated Amazon's net shipping costs as a percent of merchandise revenue, which is more relevant than looking at that ratio against total sales, which include electronic media and services for which no shipping is required. It was a hefty number - 6-7% of sales.
Now I am back this week doing the same thing for fulfillment costs - basically DC operations plus the depreciation expense for all those buildings and robots and reported as a line item by Amazon. We calculated the ratio of that expense - which doesn't include shipping, by the way - again against merchandise sales, as shown below.
Wow, fulfillment cost of 17.7% of merchandise revenues last year, up from 15.8% in 2010. No wonder Amazon can't make any money - when do the savings from all those Kiva robots kicking in?
I could do more, but think that's enough for awhile - unless convinced otherwise.
Any reaction to these additional numbers from Amazon and Walmart? Any other data you would like to see? Let us know your thoughts at the Feedback button or section below.
|