| |
|
| |
|
 |
Supply
Chain by the Numbers |
| |
|
| |
- Feb. 16, 2023
|
| |
|
| |
|
| |
|
| |
Retail Sales Jump in January; Supply Chain Robots Sales Set Record in 2022; Cargo Theft Rose Sharply Last Year; Amazon Taking Huge Share of Marketplace Seller Revenue |
| |
|
| |
| |
| ac |
| |
3.0% |
|
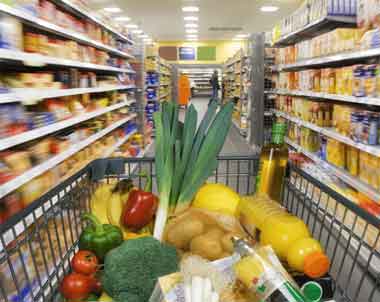
That is how much retail sales rose in January, easily topping the 1.9% Dow Jones consensus estimate, the Commerce Department reported Wednesday. The numbers are not adjusted for inflation, meaning that consumers outpaced the 0.5% inflation rate for the month versus December. However, excluding autos, retail sales rose 2.3% for the month. Restaurants led the way, surging 7.2% to lead all major categories. Motor vehicle and parts dealers increased 5.9%, while furniture and home furnishing stores saw a rise of 4.4%. Worth noting, on a year-over-year basis, retail sales increased 6.4%, which was exactly in line with the consumer price index increase reported Tuesday – meaning inflation adjusted retail sales were flat. ”Non-store retailers, generally meaning etailers, saw sales rise 5.7%, a nice jump, but below inflation.
|
|
|
|
| |
| |
|
|
|
| That was the year-over-year increase events in the US that involved theft of cargo in 2022. That according to the latest annual report from CargoNet, a logistics risk information data and consulting firm. The analysis also found that average value of cargo stolen in an event was a big $214,104 last year. CargoNet estimates that in total $223 million in cargo was stolen across all cargo theft events in 2022. The report also notes that increases in theft activity around major intermodal hubs were especially significant last year. California remained the top state for reported events in 2022 and theft in the state increased a huge 41% year-over-year. Interestingly, CargonNet says all firms should take steps to mitigate “fictitious cargo pickups,” a blend of identity theft and cargo theft that can affect all parties in a supply chain. CargoNet recorded 96 more fictitious pickups in 2022 compared to the year prior, a 600% increase year-over-year. |
|
|
|
| |
| |
50% |
|
| That’s how much of its marketplace sellers’ revenue Amazon can take, according to new report this week from Marketplace Pulse, an ecommerce data firm. That is up from 40% five years ago. Where does all that money go? Marketplace Pulses says it starts with a base transaction fee (called a "referral fee" by Amazon), Add to that two other crucial cost buckets of selling on Amazon: advertising and using Amazon's fulfillment network, Fulfillment By Amazon (FBA). Advertising can be important to get products listed higher up in search queries, and using FBA is one of the only ways to have a seller’s products available on Amazon Prime, which presents a key sales advantage. "Sellers are paying more because Amazon has increased fulfillment fees and made spending on advertising unavoidable," a blog from Marketplace Pulse noted. The study broke down fees as follows: Amazon takes its 8% to 15% transaction fee, FBA can cost from 20% to 35%, and advertising, it calculated, can cost up to 15%. |
| |
| |
| |
| |
| |
|
|
|
| |
|
 |
| |
 |
![]() |
 |
|
| |
 |
Feedback |
|
|
|
![]()
|
No Feedback on this article yet.
|
|
![]() |
|
|
|
![]() |
 |
![]() |
 |
|
| |
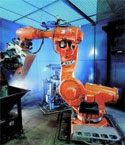 That’s how many industrial robots were ordered by companies in North America in 2022, an 11% increase over the previous year and a new record. That according to data last week from the Association for Advancing Automation (A3), a robot industry trade group. The value of those machines was some $2.38 billion, an 18% increase over 2021. The "labor shortage doesn't seem to be letting up," said Jeff Burnstein, president of A3, in a quote that came with new numbers. Many companies are struggling to find workers, with the lowest US unemployment rate since 1969, and see automation as a quick fix. As usual, more than half of last year's orders came from automakers and their suppliers - a group that has long led the way in factory automation. The data also includes robots in warehouses.