From SCDigest's On-Target E-Magazine
- July 15, 2015 -
Supply Chain News: Where is US Manufacturing Headed as we Reach Mid Year?
Growth is Still Positive, but Momentum is Clearly Slowing; Huge Differences in Recoveries Since Bottom Across Different Sectors
SCDigest Editorial Staff
We've reached the mid-point of 2015, an appropriate juncture to take a look at where US manufacturing is headed for the year.
SCDigest Says: |
 |
While the semiconductor industry in the US has seen output soar some 277% since 2007 levels, sectors such as apparel, hardware, and furniture have continued to see sharp output declines since 2007. |
|
What Do You Say?
|
|
|
|
In general, US manufacturing has been a bright spot in the overall tepid recovery of the US economy from the great recession.
But manufacturing growth has flatlined a bit over the past year and especially the first six month of 2015, and news stories about the reshoring trend seem to have slow down considerably.
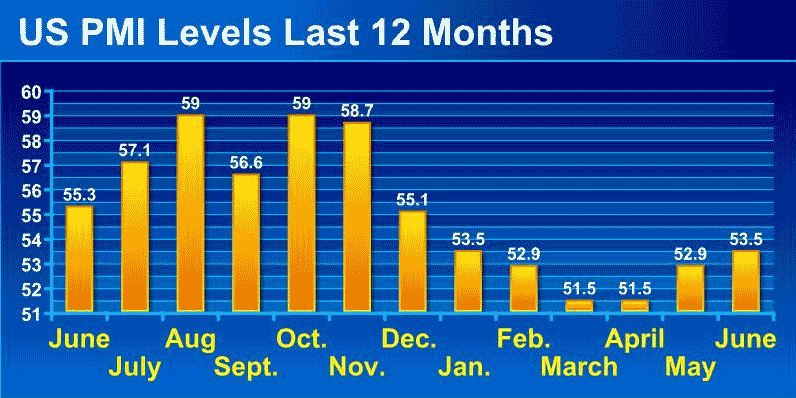
Let's start with a look at the US Purchasing Managers Index from the Institute for Supply Management, one measure of US manufacturing activity.
As most know, a score over 50 indicates that manufacturing activity is expanding, while a score below the 50 threshold indicates manufacturing contraction.
With the June results, the US has seen manufacturing expansion for the past 30 straight months - an impressive run.
But as seen in the chart below, the rate of that expansion is slowing.
The scores in the first six months of 2015 are still positive, but some 3-5 percentage points below the last six months of 2014 on average. That means US manufacturing is still expanding, but at a slower pace.
So, some mixed news there.
There is similar mixed news on the monthly data comng from the US Federal Reserve on manufacturing output.
Note we refer here specifically to manufacturing output, not the broader measure of full industrial output. That latter number includes production from utilities and mining in addition to manufacturing. Those sectors tend to be more volatile, and will show a jump in output, for example, during a very cold spell in January or a spike in temperatures in July when electricity usage jumps to heat or cool homes and businesses.

The Federal Reserve data is even more lukewarm than the PMI scores. The scores each month reflect an index, in which the baseline year (index = 100) come from the recent peak manufacturing year of 2007 (average of all months that year).
The index started to decline in 2008 in the early days of the recession, ultimately reaching a bottom in June of 2009, when the index fell all the way to about 80, among the lowest scores on record.
It was a slow but steady climb since then, but it took six years to get back to those 2007 production volumes, with the index finally reaching a score of 101.7 in July of 2014.
The good news, as shown in the interactive chart below, is that it has stayed above that 100 mark ever since. The bad news - it has also flatlined, running in a range of 101.3 to 101.9 iver the last 12 months, with very little growth over that period. That includes a score of 101.7 for June, flat with the May number, meaning output last month was 1.7% above those average 2007 levels. That was up 1.8% over June 2014.
(Manufacturing Article Continued Below)
|