From SCDigest's On-Target E-Magazine
- Nov. 12, 2013 -
Logistics News: Rail Carrier Profit Machines Keep Rolling Along in Q3
In Best Quarter of the Year, Profits Rise Sharply at all but CSX, as Operating Ratios Continue to Fall
SCDigest Editorial Staff
In an a decent volume environment in which the extremely negative impact of rapidly falling coal volumes seems to have finally abated a bit, the profit machines at US rail carriers mostly continued on in Q3, with strong gains at three of the four public US rail carriers in what appears the strongest quarter so dar in 2013.
SCDigest Says: |
 |
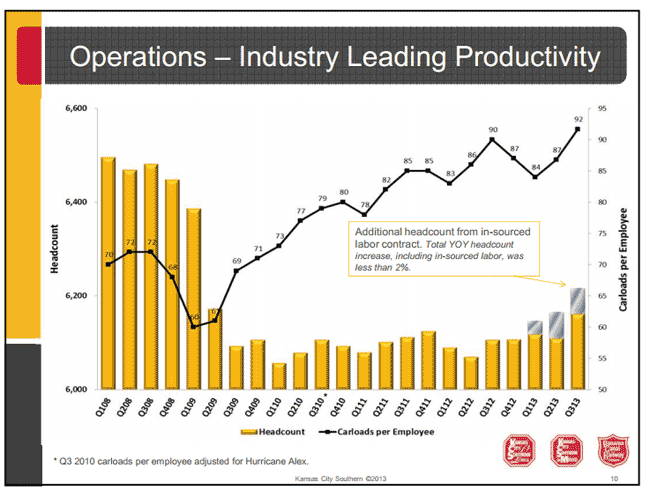
| After shedding employees during the recession, Kansas City Southern has been able to significantly improve the number of carloads it moves per employee, one reason why operating ratios are headed down for all tje carriers generally. |
|
What Do You Say?
|
|
|
|
As always, SCDigest is here this week with a review of Q3 and year-to-date 2013 results from our group of rail carriers (Union Pacific, CSX, Norfolk Southern, and Kansas City Southern.) Burlington Northern is of course now part of Warren Buffett's Berkshire Hathaway Corp. and does not post separate results.
This review includes both summary tables of financial and operating results as well as any noteworthy commentary from the various Q3 earnings releases. Both should be of interest to shippers.
Last week, we provided our Q3 review of US truckload carriers. (See US Truckload Carriers Muster Decent Q3 Result Despite Lukewarm Freight Environment.) Next week, we'll finish up with a review of less-than-truckload carrier Q3 results.
Volumes in Q3 were up 3.1% in Q3, as the punishing year over year drops in coal carloads finally started to flatten out a bit, and shipments of oil and fracking sand continued moves up. General merchandise volumes were up 5-7% at all the carriers except Kansas City Southern, as automobile shipments rose strongly for most of the carriers.
That plus continued improvements in operating efficiency and pricing power led to a impressive profit picture for most. Net income at Union Pacific, Norfolk Southern and Kansas City Southern were up 10.5%, 19.1% and an impressive 31.2% respectively. Only CSX missed the profit party, with net income rising just 1.8%.
Still, even at CSX net income was almost 16% of revenue, and the other three carriers turned in even more impressive numbers in that metric. Once one of the least profitable industries, the rail carriers are now among the most profitable, with net margins that would be the envy of most companies, which generally make less than 10% on sales.
Of course, that means operating ratios (operating expense divided by operating revenues, a key transportation industry metric) continue to fall, with Union Pacific, for example, achieving a record low OR in Q3 of just 64.8%, versus 66.6% in 2012. Amazing. A chart later in this article shows how much more efficient Kansas City Southern has become in recent years.
Below is a table summarizing results for the four carriers and overall industry totals for Q3.
Q3 US Rail Carrier Financial and Operating Results
| For Quarter Ending Sept. 30, 2013 |
Data in $Thousands |
|
|
|
|
|
|
|
|
|
| Carrier |
Total Operating Rev Including Fuel |
Change 2013 from 2012 |
Total Volume Growth (Revenue Carloads) |
Volume Growth General Merchandise, Auto, Ag, etc. |
Volume Growth Coal/Energy |
Volume Growth Intermodal |
Net Income |
Change 2013 from 2012 |
Net Income as % of Revenue |
Net Income as % of Revenue 2012 |
Operating Ratio |
Operating Ratio 2012 |
| Union Pacific |
$5,250,000 |
4.6% |
0.0% |
6.8% |
2.0% |
-1.0% |
$1,151,000 |
10.5% |
21.9% |
20.8% |
64.8% |
66.6% |
| CSX |
$2,999,000 |
3.6% |
3.0% |
5.0% |
-7.0% |
6.0% |
$463,000 |
1.8% |
15.4% |
16.0% |
71.5% |
70.5% |
| Norfolk Southern |
$2,824,000 |
4.9% |
4.0% |
6.0% |
-2.4% |
5.1% |
$482,000 |
19.9% |
17.1% |
18.7% |
69.9% |
72.9% |
| Kansas City Southern |
$621,600 |
7.7% |
3.1% |
1.1% |
1.8% |
5.5% |
$119,000 |
31.2% |
19.1% |
17.3% |
67.8% |
68.7% |
| Total Carriers |
$11,694,600 |
4.6% |
|
 |
|
 |
$2,215,000 |
11.3% |
18.4% |
18.2% |
68.5% |
69.7% |
As noted above, the chart below shows that after shedding employees during the recession, Kansas City Southern has been able to significantly improve the number of carloads it moves per employee, one reason why operating ratios are headed down for all the carriers generally.
Kansas City Southern Drives Efficiency Gains

(Transportation Management Article Continued Below)
|