From SCDigest's On-Target E-Magazine
- July 31, 2013 -
Supply Chain News: A Look at US Manufacturing Trends for the 1H of 2013
Several Sectors Hit All-Time Highs in Terms of Output; Overall, Still Well Below 2007 Base Year
SCDigest Editorial Staff
Overall, US manufacturing was close to flat in the first half of 2013, after a reasonably sharp run-up in Q4 of 2012.
This can be seen in a couple of ways.
SCDigest Says: |
 |
Clearly, there are vast differences in the fates and trajectories of different US manufacturing sectors. |
|
What Do You Say?
|
|
|
|
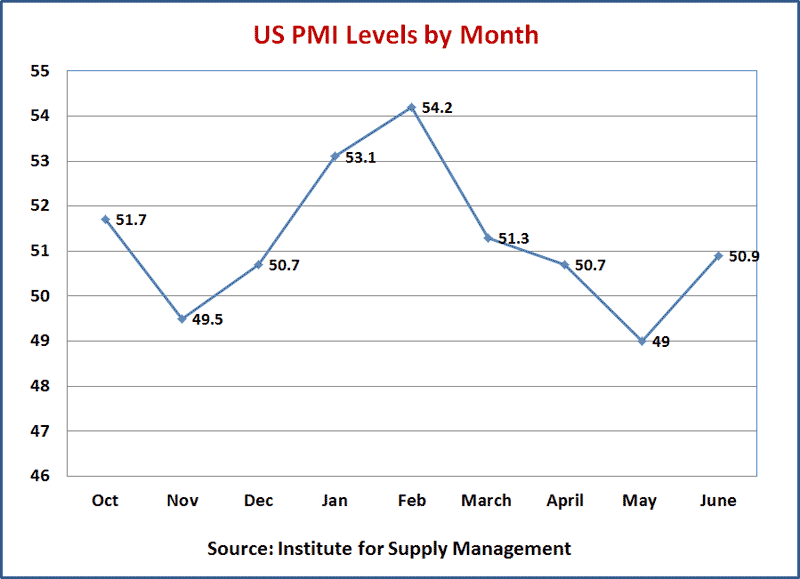
The Purchasing Managers Index from the Institute for Supply Management, which measures US manufacturing activity, started the year at a reasonably strong level of 53.1 (the 50 market separates expansion from contraction) and then rose again in February. (See interactive chart below.)
From there, however, it dropped for three straight months, including falling below the 50 mark in May, before climbing just back over 50 in June.
That in the context of an overall US economy that the Commerce Dept. now says grew 1.1% and 1.7% in Q1 and Q2, respectively - tepid real GDP growth at best.
From an output perspective, US manufacturing production (excluding mining and utilities included in the broader full industrial output) was also basically flat for the 1H, falling back as with the PMI after a brief rise early in the year. The index ranged between a high of 95.8 in February to a low of 95.2 in both January and April.
The index in June was 95.7. (See interactive chart below.)
All values are relative to the baseline year of 2007, meaning in June US manufacturing output was 4.3% below average 2007 production levels. As seen in the chart below, the long, steady climb back from the bottom in June 2009 appears for now at least to have hit a plateau.
The same is true with regard to manufacturing capacity utilization. Up from the 2009 record bottom of less than 65%, capacity utilization has again basically been flat since the beginning of 2012. (See interactive chart below.)
December's reading was 76.38%. June's was 76%. So, manufacturing capacity utilization remains more than 2.5 percentage points below the long-run (40-year) average of 78.7%.
Total US production capacity grew slightly, from an index value of 124.7 in December to 125.7 in June. That was a capacity gain of almost 1% in the first six months of the year.

(Manufacturing Article Continued Below)
|