From SCDigest's On-Target E-Magazine
- May 9, 2013 -
Logistics News: 10th Annual DC Measures Shows Companies Have Become Really Good at Logistics, as Most Measures have Plateaued at High Levels
Differences Between Leaders and Average Have Really Collapsed in Recent Years
SCDigest Editorial Staff
At the recent Warehouse Education and Research Council's conference for 2013 in Dallas, the annual "DC Measures" report was released in both document form and in a presentation from the researchers behind the report, Dr. Karl Manrodt of Georgia Southern University, and Kate Vitasek and Joseph Tillman of consulting and training company Supply Chain Visions.
SCDigest Says: |
 |
| All told, the data suggests there really isn't that much difference in distribution performance between the leaders and the average company. |
|
What Do You Say?
|
|
|
|
In a very real sense, the news this year is that there is no news, as company performance in areas related to logistics and order fulfillment seems to have reached a plateau - at very high levels.
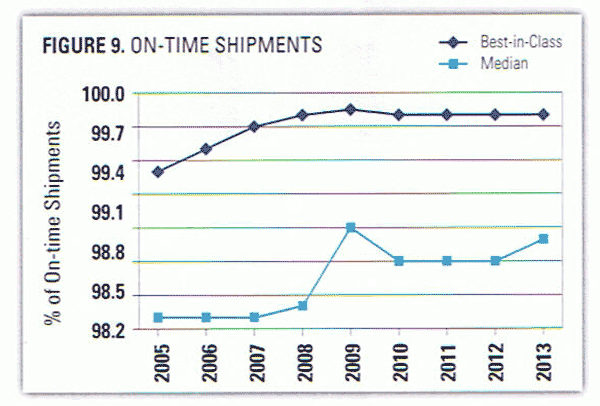
Case in point: you can't get any better than 100% on-time shipments, and again this year, the leaders (top quintile, or 20% of respondents) in the study are almost there, have reached 99.8% every year in the study since 2008. At the top, there is simply not much room for improvement, as seen in the figure below.
While the actual chart accentuates the differences between leaders and the median performance level based on the numbers selected for the Y-axis, even the average performers are hitting 98.9% on-time shipping performance, less than one percentage point below the leading companies.
SCDigest notes that if the data was measured for on-time deliveries instead, the percentage levels for leaders and average would certainly drop by a decent number of percentage points.
There are similar results in most other categories of this year's survey. For example, for the metric of "line-level fill rates" for customer orders, the top quintile has been in the 99.9% range (that actually seems a little high to us) since 2007, while the median level has been largely around 98% over the same period.
All told, the data suggests there really isn't that much difference in distribution performance between the leaders and the average company. It is likely that much of the small difference between the leaders and median performers can be connected to differences in industry sectors.

Source: WERC 2013 DC Measures
There was some volatility this year again, however, on what are the most popular distribution and logistics related measures. The study determines that ranking by the percentage of respondents actually supplying data for a given metric in their survey responses.
(Distribution/Materials Handling Story Continues Below
)
|