Supply Chain Comment
October 13, 2011
By Arnold Mark Wells, CPIM and Michael W. Okey
Supply Chain Comment: Finding the Value in Your Value
Network Part 2
Combining Six-sigma Tools with an Approach for Guiding Priorities in Process Improvement Can Deliver Powerful Results; Making it Stick
In part 1 of this two-part column series, we looked at some of the challenges faced when trying to improve supply chain performance. (See part 1 here: Finding the Value in Your Value Network).
Wells and Okey Say: |
 |
| Acquiring the data and performing the analysis can be challenging to do, even once. Sustaining better value network decisions requires improving the decision processes that were driving undesirable business symptoms and constantly seeking more process improvement. |
|
What Do You Say?
|
|
|
|
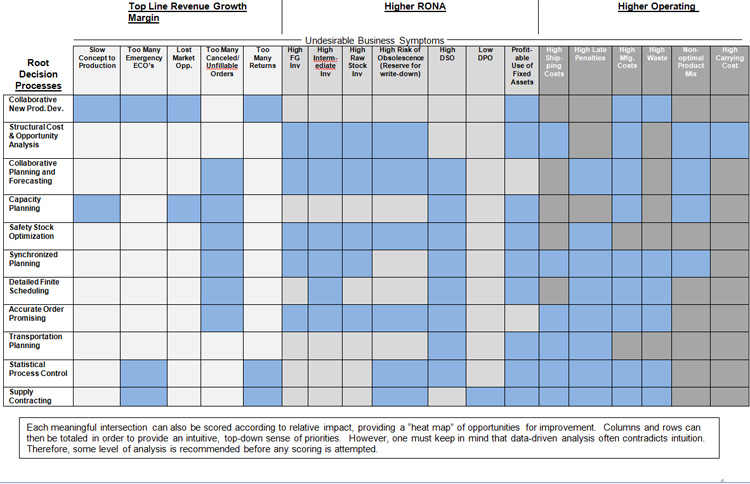
We also introduced a tool that we call the Process/Symptom/Value (PSV) Matrix. Problems with supply chain performance can be seen on the horizontal axis in the PSV Matrix, which is republiushed below in this column (see Figure 1).
From the PSV Matrix, we see that undesirable business symptoms directly and negatively impact financial measures that determine the value of the enterprise (e.g. Economic Value Added or EVA® ). We want to ameliorate these symptoms. A symptom that does not significantly inhibit revenue growth, return on net assets, or margins can be addressed as a secondary priority.
As we noted in part 1, the PSV Matrix has been composed to reflect a broad group of decision processes throughout the value network without regard to a particular methodology within a given decision process (e.g. Theory of Constraints, Lean, software applications, etc.). The PSV Matrix relates business decision processes to symptoms, ultimately allowing us to link potential root causes within each decision process to undesirable business symptoms. In the PSV Matrix, decision processes form the “y-axis”. It is helpful to think in terms of decision processes so that once the true root causes have been identified and prioritized, solutions can be addressed systemically through the improvement of a decision process.
Multiple root causes in multiple decision processes can relate to a single symptom (multiple shaded cells in a vertical column in the PSV Matrix). On the other hand, a single root cause may be causing multiple undesirable symptoms (multiple shaded cells in a horizontal row). Consequently, we must quantify and prioritize the root causes so that we know which business decision process should be attacked first.
In this column, we look in more detail about how to effectively use this concept to drive supply chain and business value.
Figure 1: The Process/Symptom/Value (PSV) Matrix

The Hard Part of Getting to the Value
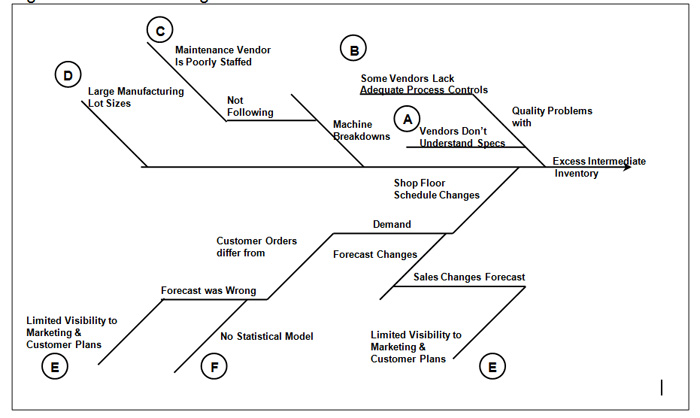
For each symptom, we trace the potential causes that make it so undesirable. Fortunately, simple tools are available to structure our thinking. Figure 2 shows one of our favorites for identifying potential root causes—a fishbone or Ishikawa diagram.
Figure 2: Fishbone Diagram

Despite the growing preponderance of business “intelligence” and “analytics”, or as we used to say in the old days, “reports”, that we might have, it is likely that the data necessary to prioritize some of these root causes will be difficult to find. Requisite data may not even be captured anywhere in our databases, spreadsheets or paper documents.
For example, consider Figure 2. The symptom is unacceptable levels of intermediate inventory. How do we capture the significance of each of the root causes (reason codes “A” through “E”)? For example, forecasting may be coming from sales. We can probably measure the accuracy pretty well by saving the forecast and then by comparing it with orders or shipments. It is harder to determine how much more effective our purchasing, manufacturing and distribution would have been if forecasts were 50% more accurate, or what the value to the shareholders could have been.
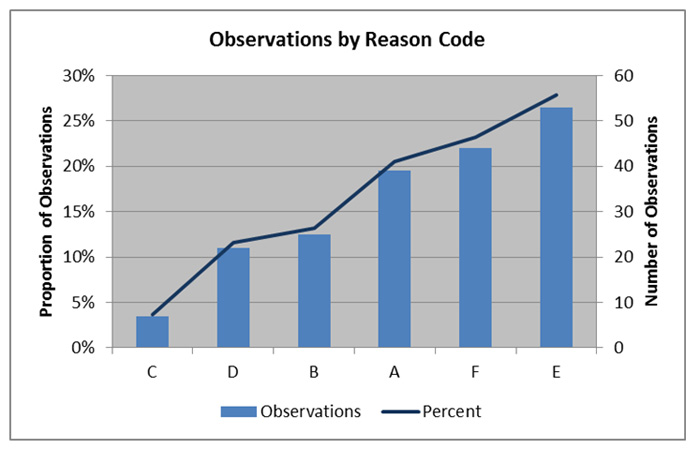
By making some observations, like how often a production run had to be interrupted to start another one based on a canceled order or a forecast that was wrong (in a make-to-stock environment), we can begin to build a collection of data that will be the foundation for answering this question. Then, by creating a graph (see Figure 3) that shows the schedule changes by reason code, we will get an understanding of the size of this problem.
Figure 3: Graph of Observations by Reason Code (Pareto View)

In our example, reason code “E”, limited visibility to customer plans, is the most significant root cause of excess intermediate inventory according to Figure 2. Additional information regarding future demand may be available from our customers or even our own marketing plans, but we do not have access to it in the forecasting process.
If we can build a demand planning business process in which to embed our sales forecasting activities (or the method for anticipating consumption) that facilitates collaboration, (both internal and external), we will address that particular root cause and reduce our intermediate, or work-in-process (WIP), inventory. By establishing a hypothesis regarding how much improvement in forecasting might be possible through this approach, we can project a possible reduction in average WIP by the average amount of WIP caused by a schedule change resulting from a poor forecast, multiplied by the proportion of assumed improvement in forecasting accuracy. By testing several hypotheses with regard to the potential improvement in the forecast accuracy and stability through a more collaborative business process, we can get a sense of the range of possible improvements.
Consider this example:
• we believe that we can reduce forecast errors by 50% through a collaborative demand planning process
• we have 4 plants, each with 40 unplanned schedule changes per year
• 25% of unplanned schedule changes or 40 schedule changes in a year are due to forecast changes/errors
• average WIP inventory is $1,000,000
• average increase in WIP caused by a schedule change is $20,000
Therefore, a collaborative demand planning process could reduce work-in-process inventory as follows:
50% reduction in forecast changes/errors x 40 schedule changes due to forecast errors = 20 less schedule changes
20 less schedule changes x $20,000 average increase in WIP due to a schedule change = $400,000 less WIP in a year
$1,000,000 current average WIP minus $400,000 less WIP created in a year means an average WIP of $600,000 – a 40% reduction in average WIP by the end of one year, reducing the amount of working capital that is required to finance inventory, freeing it up for other uses and increasing the value of the enterprise.
If the new collaborative demand planning process also includes better statistical analysis, we will take care of reason code “F” as well. We know that a collaborative demand planning process will impact many symptoms other than intermediate inventory. In fact, we may reap positive results in customer service, management of all inventories, late penalties (making what customers want to buy, not what we like to produce), production costs (less changeovers), and product mix (more profitable mix).
The point here is not that a collaborative demand planning process is the cure for WIP. Rather, this is merely an example to illustrate how root causes of undesirable business symptoms can be identified, prioritized and addressed through a business process improvement, guided and prioritized through the use of the PSV Matrix. In your business, the root cause of excessive WIP might be poor scheduling rules, setups that force long production runs, or something else altogether.
Keep in mind that a change in a decision process that exchanges the severity of one symptom in our domain for that of another symptom in the domain of someone else does little for our shareholders. In order to keep the cure from being worse than the disease, we must holistically consider the impact of addressing a symptom. Additional analysis or modeling may be required in order to determine whether a particular approach of addressing the symptom on which we are focused will have a net positive impact on revenue, RONA and costs (and therefore margins). This level of analysis usually requires a skilled and experienced practitioner who can draw on a breadth of powerful analytical techniques. Such analysis can, and is often required to, facilitate the cross-functional (integrated) decision-making that is often required to bring a decision process to the “next level”.
Making It Stick
Making an improvement last (or hopefully even become continuous) requires going just a bit further. We have learned from the Total Quality Management effort, the Six Sigma practices, and Lean operations that continuous improvement is not only desirable, but feasible. Systematic measurement and analysis of root cause factors are required for this. Hopefully, we can find a way to capture the required data using a combination of our ERP (Enterprise Resource Planning), WMS (warehouse management), and MES (manufacturing execution) systems, and the use of bar codes, RFID (radio frequency identification), or the ever growing mass of data from smart devices. In some cases, we may need to create an analysis of data from different systems. For example, timely monitoring of a production process, customer order status, and in-transit shipments may need to be combined in order to analyze and track the impact of production scheduling on late shipment penalties and customer service.
Acquiring the data and performing the analysis can be challenging to do, even once. Sustaining better value network decisions requires improving the decision processes that were driving undesirable business symptoms and constantly seeking more process improvement. This, however, may mandate a continuing analytical awareness of the relevant decision factors. There are a number of approaches for leveraging information technology to achieve this, but the possible ways for doing so comprise a topic worthy of its own separate discussion.
It is important to remember that while information technology can provide a powerful tool for sustained and continued process improvement, the critical success factors do vary by industry, and companies achieve competitive advantage by innovating in their value network decision (and execution) processes. Just as it is never good enough to rest on our laurels, neither is it sufficient just to mimic the “best practices” of another organization.
Summary
Through careful data gathering and analysis, aided by the Process/Symptom/Value Matrix, we can identify the undesirable business symptoms that are most critical to our business. The PSV Matrix relates these symptoms to decision processes, giving us the insight we need to generate more value through the business network by driving improved revenues, lower costs, and/or higher return on net assets.
The key to achieving this goal lies in following the simple method we have discussed in this article:
1. Identify the undesirable business symptoms
2. Relate them to financial impact (revenue growth, return on net assets, and margins) and relevant business decision processes through the PSV Matrix
3. Rank or prioritize the undesirable business symptoms based on their detriment to value. This may be intuitive, but should probably be confirmed with data analysis.
4. Map symptoms to the root causes through the use of cause and effect analysis (fishbone diagram)
5. Evaluate and prioritize root causes. This may require data cleansing, capture and analysis.
6. Relate root causes to business decision processes (i.e. which decisions need to be improved in order to eliminate the root cause) through the use of the PSV Matrix
7. Eliminate the most critical root causes of undesirable business symptoms by improving the appropriate business decision process or processes. This may require analysis and modeling, not only to improve the decision process, but also to ensure cross-functional and integrated decisions are achieved.
What are your thoughts on our commentator's perpspective? Let us know your thoughts at the Feedback button below.
|