 |
March 19, 2015 - Supply Chain Flagship Newsletter |
 |
| FEATURED SPONSOR: VCU |
||
 |
||
|
||
 |
|
||||||||||||||||||||||||||||||||||||||||||||||||||||||||||||||||||||||||||||||||||||||
I will quickly note that a few readers commented that my first column alerted them to the fact that you really have to dig into almost any numbers reported by someone to see if they make sense and/or understand what they really mean. This is absolutely true, and I could give you many examples, but an easy one is the monthly numbers from the Federal Reserve on US industrial output. The number might spike say in July, generating glowing economic headlines. But if you look at the data closely it might have been because total industrial output includes utilities (and mining), and the jump might have been due to a very hot month in which everyone was cranking up the AC. SCDigest always just looks at the manufacturing numbers, for a better view of the real economy. So, we compute the numbers based on the same formula we used last time to analyze Walmart's share of US retail, for which we take total retail and subtract out cars, parts, gas stations, fuel dealers and restaurants. Using that formula, ecommerce sales were a much higher 9.9% of total retail sales in 2014, up strongly from 8.8% in 2013. Of course, that share is much higher in some product categories, such as electronics and apparel.
Last time, we also graphed the annual percentage growth for Walmart's US retail sales, which have slowed noticeably in recent years. Below we show the Walmart numbers in absolute terms across its three reporting units: US, Sam's Club, and International. All units have seen the pace of growth slow, and the recent big slowdown in international is a bit puzzling.
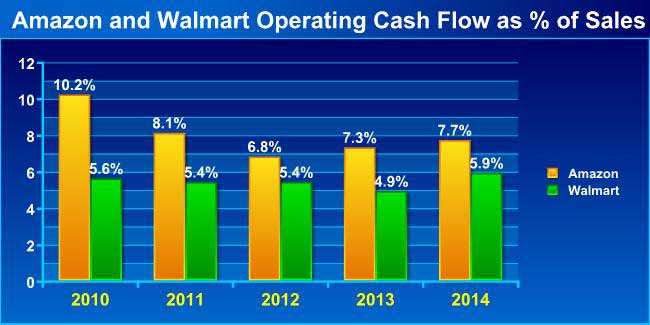
The cumulative average growth rate (CAGR) for each unit and total sales is shown beneath the chart. it shows an average CAGR of a pretty decent 4.8% for total sales from 2004 through 2014, but that comes much more from the first half of that period than the last few years for sure. Switching gears, Amazon get much criticism for its consistent failure to really make any money, though it eked out a small profit in Q4 after small losses the rest of 2014. But others say look instead at Amazon's cash flow from operations, which paints a better picture, and indeed operating cash flow is higher as a percent of revenue than Walmart's of late, as shown in the chart below. Note the consistency of the Walmart numbers.
But there is operating cash flow and what is called "free cash flow." The latter equals operating cash flow minus capital expenditures, and here is where Amazon's spending habits kick in. While Amazon had operating cash flow of $6.8 billion in 2014, it had Capex of...$4.89 billion, or a whopping 72% of operating cash flow. Walmart, on the other hand, had Capex of about $12 billion against $28.5 billion in operating cash flow, or just 42%. (You could look at this other ways, such as deducting gains on assets sold during the year from the Capex spend to get a net total, but my numbers tell the story as is). Ok, finally I previously calculated Amazon's net shipping costs as a percent of merchandise revenue, which is more relevant than looking at that ratio against total sales, which include electronic media and services for which no shipping is required. It was a hefty number - 6-7% of sales. Now I am back this week doing the same thing for fulfillment costs - basically DC operations plus the depreciation expense for all those buildings and robots and reported as a line item by Amazon. We calculated the ratio of that expense - which doesn't include shipping, by the way - again against merchandise sales, as shown below.
Wow, fulfillment cost of 17.7% of merchandise revenues last year, up from 15.8% in 2010. No wonder Amazon can't make any money - when do the savings from all those Kiva robots kicking in? I could do more, but think that's enough for awhile - unless convinced otherwise.
|
|||||||||||||||||||||||||||||||||||||||||||||||||||||||||||||||||||||||||||||||||||||||
|
|||||||||||||||||||||||||||||||||||||||||||||||||||||||||||||||||||||||||||||||||||||||
|
|||||||||||||||||||||||||||||||||||||||||||||||||||||||||||||||||||||||||||||||||||||||


|
|
|


YOUR FEEDBACK
We received a number of emails on our article on Amazon's plans for a "ninth generation" fulfillment center design. The eighth generation design is in place at 10 DC's and features widespread use of the Kiva robots Amazon acquired in 2012. Who else thinks in terms of generations of DC besides Amazon?
Some of the Feedback is from our friends over at RetailWire, which summarized our article.
Feedback on Amazon 9th Generation Fulfillment Centers:
The rules for warehouse technology investment have not changed since before the days of Web Van. If the investment does not pay back in seven years or less from labor savings it is a bad investment. Note with this new system Amazon is implementing, the warehouse is larger and the inventory has increased 50 percent. These additional cost must be paid for with additional labor savings over the savings for the equipment investment. Warehouse labor cost is created by product touches. In this system, there is the receiving touch, put away touch, replenishment touch and picking touch. A flow through the warehouse has the receiving touch and truck loading touch. This is the minimum possible except for store drop ship. Amazon's new system works well for small light items. The average dry grocery case weighs 28 pounds and a paper case is five cubic feet. Heavy and large cases will not work with this system. Furthermore, the high volume items are likely to incur additional cost by delays at the picker station. Therefore the advantage or disadvantage depends on the industry. W. Frank Dell President
|
||
Simplification is one thing (of many) that Amazon has done right as it manages accelerated growth. Easy to see from the consumer perspective, but harder to understand from the supply chain side. Maybe even a bit counter-intuitive. So this is an example of how they have simplified the DC/FC challenge. To the posted question, Kiva robotics clearly appear to work well in dry environments but may not be ready for the special challenges of the perishables supply chain. Plus don't forget the human factor here, represented by long-standing union contracts and by corporate commitments to their employees. Many food/beverage companies work hard to stay connected to their marketplace through their philosophies and actions. Not so with Amazon, starting from scratch, building a new supply chain. Does anyone else see a similarity to supply chain of Soylent Industries, the fictional company in the classic movie "Soylent Green" (set in 2022, by the way)?
Dan Raftery
|
||
| Clearly this is a major advantage for Amazon. Consumers experience peer reviews, recommendations and pricing, but how products get to them quickly or when expected is unknown to them. Most competitors are probably three to four generations behind Amazon's fulfillment center technology and logistics and they know it. Also not many competitors have the capability of financing and executing leapfrogging their fulfillment centers up to cutting edge standards. Amazon may have lost some pricing advantages, fumbled with its phone and may not make shareholders happy, but it has no worries about competitors taking its fulfillment dominance away anytime soon. The best avenue for brick-and-mortar retailers to look for a competitive advantage is to up their game in physical stores where Amazon has no real footing and has to play catch up.
Ken Lonyai |
SUPPLY CHAIN TRIVIA ANSWER
Q: What was the US trade deficit in goods with China in 2014 (in dollars)?
A: $342 billion, setting yet another record.
| © SupplyChainDigest™ 2003-2015. All Rights Reserved. SupplyChainDigest PO Box 714 Springboro, Ohio 45066 |
POWERED BY: XDIMENSION
|