 |
June 18, 2014 - Supply Chain Flagship Newsletter |
 |
| THIS WEEK'S SPONSOR: JDA |
 |
|
 |
|
|||||||||||||||||||||||||||||||||||||||||||||||||||||||||||||||||||||||||||||||||||||
State of the Logistics Union 2014
|
||||||||||||||||||||||||||||||||||||||||||||||||||||||||||||||||||||||||||||||||||||||
| GILMORE SAYS: |
"We will note here that what the true carrying cost of inventory should be is far from an exact science." WHAT DO YOU SAY? |
As a comparison, logistics costs as a percent of GDP were estimated at 15.8% in 1981 (as trucking deregulation was just starting and interest rates were high) and 12% in 1985. So as an industry we have made much progress.
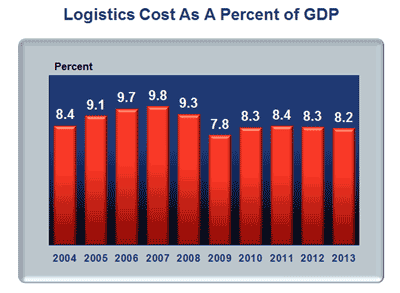
To make sense of all that, a graph of the last 10 years of logistics costs as a percent of GDP is provided below.
This notion that relative logistics costs actually fell in 2013 frankly surprises me, but somehow transport rate hikes were low despite tight capacity.
All told, US logistics expenses, as measured by this methodology, were up 2.3% in 2013, but nominal GDP rose a bit faster than that. Wait, you may be saying, GDP rose only 1.9% in 2013. No, that was the number for the growth of "real" GDP , which reduces nominal GDP by an inflation factor. Since logistics costs in this report are measured in nominal terms (only way to really do it), the comparison has to be against the nominal not real GDP level.
This represents the 25th edition of the report, which was launched in 1988 by the late Bob Delaney and sponsored by his company, Cass Information Systems. Somewhere along the way, CSCMP took over the sponsorship, and in the late 1990s Wilson, who has a long career in the logistics industry, began to support Delaney in his efforts. Upon Delaney's passing a few years later, Wilson took on the challenge alone, largely keeping the existing methodology.
Just for perspective, the total cost of US logistics was estimated at $1.39 trillion for 2013, up $31 billion from 2012. A lot of elements go into that number, from warehouses to trucking to pipelines, but the three main categories are inventory carrying costs, including the costs of warehousing (33.9% of the total logistics spend in 2013), transportation costs (61.5%), and administrative costs, mostly related to logistics IT spend not otherwise captured in the other two categories (just 4.6% of the total).
You can see this breakdown here in our Supply Chain Graphic of the Week.
Within transportation, trucking-related costs comprise 77.2% of total transport costs and 47.5% of total logistics spend, while other modes (rail, water, pipelines, freight forwarders, etc.) account for 22.8% of transportation spend and 14.1% of the total logistics costs.

Source: State of Logistics Report 2014/CSCMP
View Full Image
All those numbers above were little changed in 2013 versus 2012 or really the past few years. Trucking's share of transportation spend fell slightly again, down two-tenths of a percentage point, after a half a percentage point drop the year before.
My guess that is mostly reflective of a fairly weak rate environment in 2013 versus the rail carriers, who commanded somewhat higher rates again. Also, I do not believe this methodology accounts for private fleet activities, unless a dedicated fleet from a commercial carrier is used.
Total rail freight revenue rose 3.6% on a gain in ton-miles of 1.6%. In 2012, rail spend had risen 4.3% on a decline in ton miles, so the pricing power for the rail carriers seems to have diminished a bit versus previous years.
The approximate $1.39 trillion in total logistics spend is 21% above the 2009 bottom, and is higher in absolute terms than any year but the peak year of 2007, when spend was $1.42 trillion.
That seven years later we are still not back to the logistics spending level we saw in 2007 is really amazing, and shows just how deep the great recession really was. Greater logistics efficiency, such as the rise in intermodal volumes, may play some role here, but I’ll note US manufacturing levels are still not back to 2007 levels, though we are at last knocking at the door - the just released numbers for May show the manufacturing index at 99.5, half a point below the 2007 benchmark.
Inventory carrying costs were up 2.8% in 2013, down from a rise of 4% in 2012. But most of that rise in carrying costs in absolute terms came from a similar rise in total inventory levels. The higher the absolute level of inventory, the higher the absolute spend for insurance, taxes, depreciation, etc.
The inventory-to-sales ratio bounced around a bit, but was basically unchanged for the year. After reaching a recent peak earlier in the recession at 1.49, the ISR rate has remained fairly stable in the 1.26 to 1.28% range.
That said, continuing a recent trend, retail inventories are rising faster than those in manufacturing and wholesale distribution. Retail inventories rose 6.2% year over year, and increased in every quarter in 2013.
By comparison, manufacturing inventories rose just 2.1% in absolute terms and wholesale inventories only 2.7%, not much at all when you consider those numbers include growth due to increased sales and any inflation.
We will note here that what the true carrying cost of inventory should be is far from an exact science, and others might calculate this macro-number differently than Wilson does. However, the report has been using the same methodology for years, so year over year the numbers and direction are consistent and do reflect real trends. Interest rates were actually down a bit in 2013, so that mitigated the costs of higher absolute inventories.
The annualized rates for "commercial paper" (short term bonds for corporations) was astoundingly just .9% last year, versus 1.1% in 2012. Obviously, in times of higher interest rates, inventory carrying costs can spike using this approach. Wilson notes that if the 2007 interest rate of 5.07% was substituted, total logistics cost would have increase by $128 billion. This, in turn, would have changed logistics cost as a percent of GDP from 8.2 to 9.0%.
Transportation costs were only up 2% in 2012, down from a 3% rise in 2012. The report basically uses carrier revenues by mode as the measure of transportation spend.
In the trucking sector, spend was up about 1.6%, on tonnage gains said to be 6.1%. That would imply rates are declining, though Wilson characterizes them as flat, and notes the 2013 growth was "one of the weakest revenue years in recent history" for truckers.
This is strange, though good news for shippers. We had strong gains in volumes, at least as measured by tonnage, Wilson said that in 2013 the industry was operating at near full capacity (at least in truckload), and yet rates were flat. Very odd, and a condition that is clearly changing here in 2014.
A few other highlights from the report:
Class 8 truck registrations declined 4.5% in 2013, contributing to the tightness in capacity. The new trucks are so expensive, it makes it difficult for the carriers to afford the upgrades.
The cost of warehousing was up 5.6% in 2013, as rates for warehouse space continue to rise. "Fourth-quarter demand was particularly strong and reached the highest level on record," Wilson says.
Report notes that "More and more drivers are walking away from the industry because of increased burden and decreased wages." The decreased wages are coming from HOS rules and electronic data loggers that reduce miles driven per week.
At the end of 2013, trucking bankruptcies had increased for seven consecutive quarters and were at a three-year high. Report says that the increase in expenses and prohibitive cost of adding new drivers reduced US truckload capacity by 2.5% in 2013.
Given the situation, report says carriers can probably increase rates 5-8% in 2014.
There is more, but that's all I have room for. Nice job as usual by Wilson and CSCMP.
The report is available at no charge for CSCMP members, of which I am one. It can also be purchased by non-members. We will do a video summary in our news broadcast with CSCMP coming up on Monday.
Any reaction to this year's State of Logistics report for 2014? Let us know your thoughts at the Feedback section below.
![]()
| View Web/Printable Version of this Column |
|
|
|
YOUR FEEDBACK
We received a a scattering of feedback from our "trip reports" from various conference over the past few weeks. You will find some of the comments stemming from those summaries below/
Feedback on the Supply Chain Talent Crisis (Gartner Summary):
We've got to get out if denial and into proactive, sustainable, long-term solutions. Art van Bodegraven
|
||
| On the Bullwhip Effect (JDA Summary): | ||
Regarding the Bullwhip effect I invariably test it out on my training courses and the syndrome is alive and kicking 50+ years on! May I suggest one reason for its longevity. The right people in the customer/supplier are just not talking to the right people in the supplier/customer. If you are a customer who is having problems with order fulfillment then the short term action is naturally to increase the order and the cycle is started. Too often the customer does not know who to talk to so a difference can be made. Change requires closer integration of strategic, tactical and operational activities and that is rarely easy, particularly in the supply chain where "steady state" is an environment achieved only momentarily, and then so fleetingly that it is invariably too late to take advantage of. Sorry about the pessimism but at least we are talking about the issue and spreading awareness can only help to diminish the problems caused by failure to identify true demand. |
||
On a Hierarchy of Supply Chain Metrics (Gartner Summary): |
||
Gartner is right: "Forecast Accuracy" should be the pre-eminent supply chain measure and here is the reason why.
Consumer spending represents two thirds of the economy and 75% of this spending is done in the Consumer Packaged Goods Industry. Forecasting accurately what consumers will buy in a given store has more overall impact on manufacturing & logistics costs than anything else I can think of. It effects everything we do up and down the entire retail supply chain. Andre' Martin |
||
| On SCDigest Conference Coverage: | ||
I have often wondered why others don't really do what you do with these conference: smart, succinct summaries and insight, usually just a day or two after the event ends. I have simply come to the conclusion that it is just that no one else can really do what you do. Congratulations. Please keep up the good work, it is very helpful. Dwayne Koch |
||
SUPPLY CHAIN TRIVIA ANSWER
Q: Which US public freight carriers have consistently been the most profitable in recent years, as measured by net income as a percent of sales, in each of truckload, LTL and rail modes?
A: Truckload: Heartland Express; LTL: Old Dominion; Rail: Union Pacific.
| © SupplyChainDigest™ 2003-2013. All Rights Reserved. SupplyChainDigest PO Box 714 Springboro, Ohio 45066 |
POWERED BY: XDIMENSION
|


