From SCDigest's On-Target E-Magazine
- April 14, 2015 -
Supply Chain News: United Nations says China Remains Number 1 in Manufacturing, as US Stays in Second Place, but Share is Shrinking
China Averaged Astounding 11% Annual Growth in Units Produced for Past Decade; US saw 1.3% Average Increase
SCDigest Editorial Staff
Not everyone agrees depending on their methodologies, but a recent article from MAPI – The Manufacturing Alliance, reporting on data out of the United Nations, said that China remains on top in terms of global manufacturing and has extended its lead.
SCDigest Says: |
 |
When the MAPI divided total value-add by population size to get a per capita number for leading countries, a different picture emerges. |
|
What Do You Say?
|
|
|
|
Based on measuring total manufacturing "value-add," the UN says China first over took the US in 2010. Value-add means, for example, that if material for an apparel item costing $3.00 is sent to China for sewing, and the China factory then sells the item for $7.00, it gets a $4.00 value-add for each piece sold. (There are other factors in the calculation, as descried below).
China's manufacturing value-add reached $2.74 trillion in 2013 compared with $2.03 trillion for the United States. That gave China a global manufacturing share of 23.2% for the year, versus 17.2% for the US.
In 2010, China global share was 18.9%, just ahead of the US at 18.1%.
China's ascent has simply been remarkable. Its rise in actual physical volume - the number of things it produces - rose at a compound annual growth rate of a robust 11% from 2003 through 2013. At that 11% growth rate, it means China is doubling its production unit volume every seven years. When combined with other factors in the calculation, it means China is doubling its value-add every four years, an unbelievable pace.
By comparison, US unit output rose just 1.3% annually during the same period.
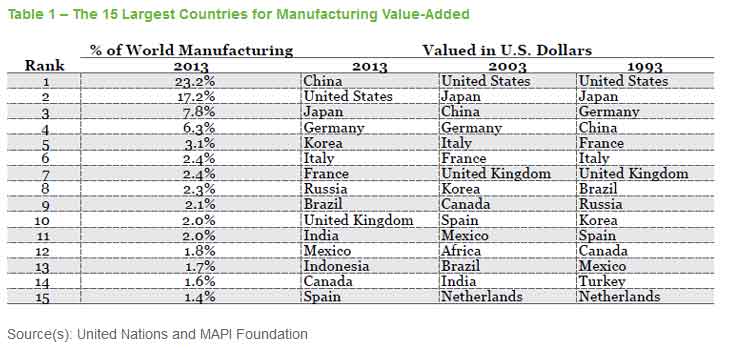
Several other emerging economies rose in the ranks; Korea jumped from 10th to 8th to 5th from 1993 to 2013 to 2013. From 2003 to 2013, India rose from 14th to 11th, Russia rose from 18th to 8th, and Indonesia rose from 19th to 13th. Mexico, however, actually fell one position in the rankings, to 12th place.
The table below from MAPI shows the rankings based on global percentage of total value-add for 2013, and then how the countries stacked up by the same measure in 2003 and 1993. We were frankly a bit surprised to see China was ranked as high as fourth all the way back in 1993.
Another table from MAPI shows the components that go into the calculations of the value-added total, as well as the physical volume CAGR from 2003 through 2013, for the top 15 manufacturing nations.
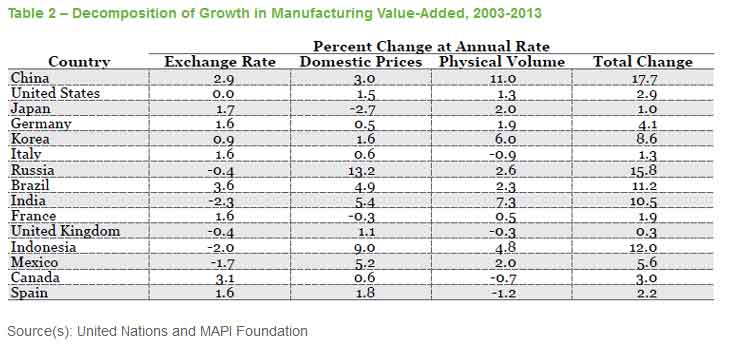
Korea saw a strong 8.6% annual rate of growth in manufacturing value-added over the period, with physical volume rising at 6.0% annually.
India's value-added grew 10.5% a year during the period. The composition of that annual dollar-based growth was 5.4% inflation, 2.3% currency depreciation, and a strong 7.3% growth in physical volume.
Brazil's growth came mostly from inflation. Manufacturing value-added increased 11.2% a year over the period, composed of 4.9% inflation, 3.6% currency appreciation, and a relatively modest 2.3% increase in physical volume.
(Manufacturing Article Continued Below)
|

