SEARCH searchBY TOPIC
right_division Green SCM Distribution
Bookmark us
sitemap
SCDigest Logo


distribution

Focus: Transportation Management

Feature Article from Our Transportation Management Subject Area - See All
 

From SCDigest's On-Target E-Magazine

- July 30, 2013 -


Logistics News: Mixed Q2 for US Truckload Carriers, as Evolution Continues for Many


Decent Profits in Slow Freight Environment, with Profits Up 6.2%, though Results Vary Significantly Across Carriers;  Attraction to Intermodal, Dedicated and Brokerage Continues


SCDigest Editorial Staff


In an volume environment many characterized as "lackluster," public truckload carriers posted very mixed results in Q2.

SCDigest Says:

start
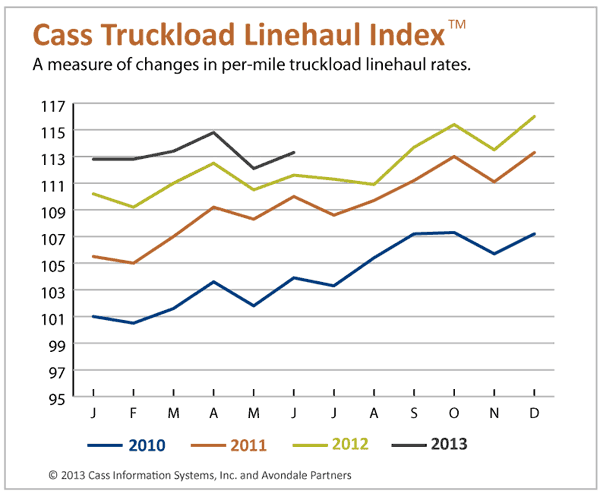
In terms of pricing, the Cass Linehaul Index shows that rates, while falling versus Q1 as is typical, were consistently about 2% above 2012 levels.
close
What Do You Say?
Click Here to Send Us Your Comments
feedback
Click Here to See Reader Feedback

As always, SCDigest is here this week with a review of Q2 and the full first half of 2013 results from our group of seven publicly traded carriers (note:giant Schneider National continues to be a private company).

Last week, we covered the rail carriers. (See Union Pacific Separates Itself from the Pack in Q2.) Next week, we will be back with Q2 results for the LTL carriers.


From an overall industry perspective, the American Trucking Associations said trucking volumes (including LTL) were up 4.3% in April year-over-year, 6.5% in May and 5.9% in June, much stronger than most of the carriers in our group reported.


For example, Swift saw a rise of just 2.1% in loaded miles in Q2, which seemed about on par with most others. It could be, however, that part of the delta between ATA tonnage figures and carrier reports might be explained  by growth in dedicated carriage, which is generally reported as a different segment than straight truckload business.


And the evolution of many carriers away from straight truckload to dedicated, intermodal and brokerage services continues apace at many in the industry.


Most notable, of course, at JB Hunt, where the truckload business continued its freefall in Q2, down more than 19% in revenue, and at a little over $100 million in sales accounts for just 7% of total revenues, down from 10% in 2012. The story is even more dramatic in terms of profits, where the truckload segment produced just 2% of total profits versus a still tiny 7% in Q2 last year.


But it isn't only happening at Hunt, even if this is the extreme case. Straight truckload revenues fell 3.6% in Q2 at Werner, while dedicated and intermodal segments rose a combined 7.1%. The truckload business at Knight fell 2.6 in Q2, but its brokerage business soared a robust 64%, though off a small base, and now accounts for about 20% of total revenue.


In terms of pricing, the Cass Linehaul Index shows that rates, while falling versus Q1 as is typical, were consistently about 2% above 2012 levels. That would seem at the high end of the range of our carrier group, which reported modest rate increases of 1-1.5% for the most part.


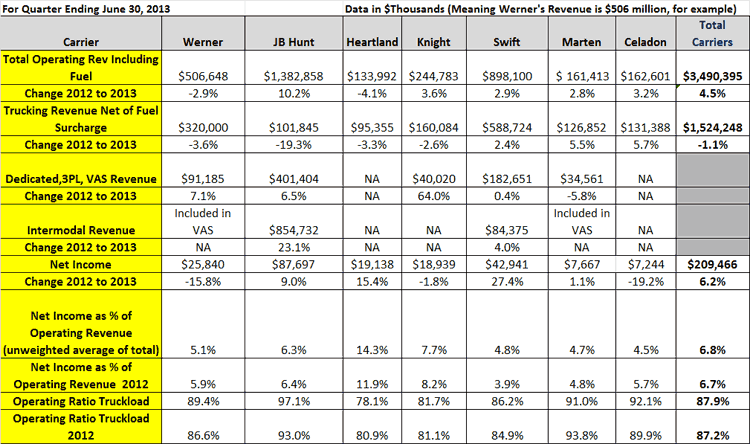
All told, it was a decent quarter for the TL carriers, with total revenues including fuel surcharge up 4.5%, while profits were up a decent 6.2% in aggregate, as shown in the table below.


Truckload Carrier Q2 2013 Results


See Full Size Image


But as can be seen, results varied quite a bit across carriers. Revenue fell 3-4% at Werner and Heartland while soaring 10% at JB Hunt, as usual on the back of its intermodal and brokerage segments. Revenue was up 3-4% at all the rest.


Profits were an even more unequal story, dropping sharply at Werner and Celadon, rising rapidly at Hunt, Heartland and Swift, and coming in nearly flat at Marten and Knight.


Unweighted (meaning size of revenues is not considered) operating ratios (operating expense divided by operating revenues) came in for the group at about 88%, a little above 2012 and decent but not outstanding performance.


(Transportation Management Article Continued Below)

 
CATEGORY SPONSOR: SOFTEON


Results for the first half of the year, as shown in the table below, are largely the same as for Q2. Pure trucking revenue remains very flat for the group, while most see a lot more growth from intermodal and other value-added services.


Total net income was up a strong 13.2% for the group, led by Swift, up 66%.


See Full Size Image


As usual, we also share some of the more noteworthy management comments from the carriers from their Q2 earnings releases.


Werner


Average revenues per total mile, net of fuel surcharge, rose 1.6% in second quarter 2013 compared to second quarter 2012. Base rate increases showed modestly positive momentum as the second quarter 2013 progressed.

Spot market rates were lower in second quarter 2013 than in second quarter 2012 due to lower transactional project business, particularly in the Midwest market.

Noted that tt is very difficult for many smaller and medium size private carriers to replace their older, lower-value trucks with much higher cost, EPA-compliant new trucks, which significantly reduces the risk of trucks being added to the market, as capacity overall remains flat.


JB Hunt


Load growth of 12% in Intermodal (JBI) and 29% in Integrated Capacity Solutions (ICS), helped drive a 12% and 20% increase in segment revenue, respectively.


Hunt's Dedicated Contract Services (DCS) segment revenue increased by  13% as new, large private fleet conversions continue to be implemented at shippers.


In the truckload segment, rate per mile, excluding fuel surcharges, increased 2.1% on a 10% shorter length of haul. However, rates from consistent shippers decreased 0.6% compared to the same quarter a year ago in order to retain business that fell within profitable network lanes.


Heartland


The average age of the company's tractor fleet was 2.0 years as of June 30, 2013 compared to 2.2 years as of June 30, 2012. Heartland took delivery of 190 new trucks during the second quarter which included International ProStar Plus and Freightliner Cascadia models.


The tractor fleet upgrade will continue through the second half of 2013 with the scheduled purchase of an additional 800 units. The average age of the company's trailer fleet was 3.2 years at June 30, 2013 compared to 3.5 years at June 30, 2012, with 98% of its trailers being 2007 models and newer at the end of the quarter.


Knight


Company said the industry continues to be faced with a shortage of high quality driving associates, and that "Sourcing and retaining high quality drivers is paramount to our success in improving the productivity of our assets."


Knight said it believes its decentralized regional service centers provide a ''hometown'' feel that affords it a significant advantage in recruiting, retaining, and developing drivers.


Average tractor count for the quarter decreased 107 trucks, year-over-year, to 3,963 tractors.


Seems to have a large focus on growing its non-asset (brokerage) business.


Revenue per loaded mile, net of fuel surcharge, increased just less than 1.0% while length of haul and miles per tractor were virtually flat.


Marten


Total truckload, intermodal and broker loads were up 13.2% in the second quarter of 2013 over the prior year's quarter. This represents one of the strongest volume improvements in the group, implying solid market share gains.


Swift


Described Q2 as a " a relatively lackluster freight environment."


Said Q2 marked "the 6th consecutive quarter, and the 14th of the last 15 quarters, where our team has been able to improve the year over year loaded utilization in our truckload segment."


At 10,903, total tractors available are down significantly from the 12,132 the company operated in Q2 2011.


Any reaction to the truckload Q2 and 1h 2013 results? Let us know your thoughts at the Feedback button (for email) or section (for web form) below.


Recent Feedback


No Feedback on this article yet


.