We've been making our way through this year's report from the American Trucking Associations on its US Freight Transportation Forecast to 2024.
There is a wealth of interesting and informative information in the report, some of which we summarized in an On-Target article earlier this week. (See Interesting Predictions on How US Freight Market Will Play Out over Next 12 Years.)
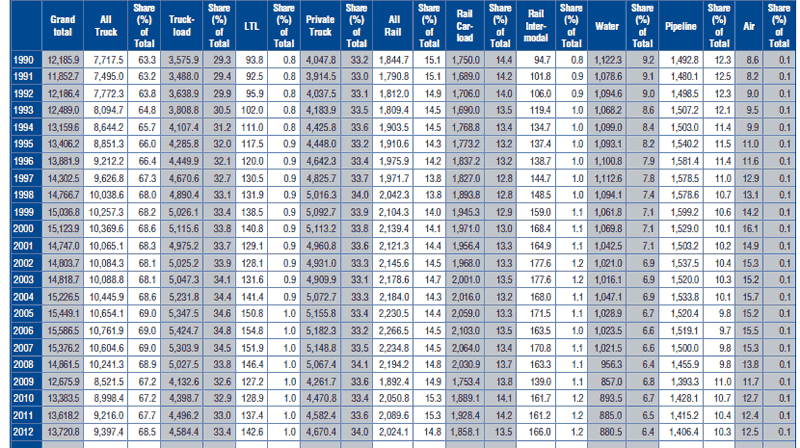
Here, we present as our Graphic of the Week another table in the report showing data relative to tonnage volumes by different modes from 1990 all the way through 2012.
US Freight Tonnage by Mode 1990-2012 (in Million of Tons)

Source: American Trucking Associations
Several things stand out, starting with the rather amazing fact that total tonnage over this period has increased only 12%, from 12,185 million tons to 13,720 in 2012. That as the US economy has grown by more than 60% over the same period.
How can this be? We're frankly not quite sure, though the fact that everything from televisions to laundry detegent is actually or effectively smaller in size and weight must be part of it. Still, the amount of this delta seems odd.
Also worth noting is that 2012 tonnage volumes were lower than every single year from 1996 through 2008. Wow. It is still a 1,000 million tons (meaning 1 billion tons) below 2008 levels.
Second, we are struck that despite what has since 1990 been a supply chain revolution of sorts, characterized by dynamic changes in markets and the environment, it appears very little has actually changed in US freight transportation patterns over that time.
The most significant change is that the trucking sector's share has risen 5 percentage points since 1990, from 63.3% to 68.5% last year. But almost all that gain came early on - there has been little share movement since the late 1990s.
We were also quite surprised that there wasn't more growth in rail sector volumes, given the success of the US rail carriers over the past decade or so. But rail's overall share - at about 15% of US freight - has stayed nearly the same for more than 20 years - though we will note that intermodal has been growing relatively fast in percentage terms. But even with that, intermodal still accounts for just 1.2% of total US tonnage.
We were also surprised that the LTL sector (which includes parcel shipments in the calculation of the ATA's chief economist Bob Costello) accounts for just 1% or so of US tonnage.
There many other insights from this data in the table - have a good look.
Any Feedback on our Supply Chain Graphic of the Week? Let us know your thoughts at the Feedback section below. |