1H 2022 Supply Chain in Numbers and Charts
As I wrote two weeks, there were lots of supply chain issues and action in the first half of 2022, from war in Ukraine to soaring inflation and much more. (See The Top Supply Chain Stories by Month 1H 2022.)
This week, we offer our popular look at the first six months of 2022 in numbers and charts.
We always start with a check on the US and global economy, as that has such an impact in the end on supply chain practice.
| GILMORE SAYS: |
WHAT DO YOU SAY?'
In Q1, the most recent number we have, US ecommerce sales were up 6.6% versus 2021 - below overall retail sales growth of 10.9%.
Send us your
Feedback here
|
Real US GDP was down 1.6% in Q1, with the Q2 number due any day. Some are expecting anothe relatively small decline, which if accurate would move the US into recession with consecute negative quarters.
On July 1, for example, the Federal Reserve Bank of Atlanta lowered its Q2 GDP projection to -2.1%, a rather sharp decline. Other economists are predicing a small increase instead.
A few weeks ago, the International Monetary Fund said it now expects US GDP to grow 2.9% for all 2022, less than its most recent forecast of 3.7% in April. I think that is still too high.
The IMF also warned it will again cut the forecast for global economic growth, after already downgrading it to 3.6% in April.
China eked out GDP growth of 0.4% in the second quarter from a year ago, after 4.8% growth in Q1.
Inflation is perhaps the top domestic story of the 1H. The consumer price index rose 9.1% in June, even more than expected and largest jump in 40 year. After rising 7.5% in January, CPI growth rose all but one month since.
Consistent with dropping GDP numbers, the US Purchasing Managers Index from the Institute of Supply Management has been tailing off in recent months, as shown below, though still holding above the 50 mark that separate US manufacturing expansion from contraction. Will that hold for the rest of 2022?
Another view of US manufacturing strength is the index on US factory output from the Federal Reserve.
The index for June came out at 101.6, up 1.6% from January. However, the June score is still well below the 105 level in February 2020 right before the COVID crisis.
In fact, at 101.6, it means US manufacturing output is also just 1.6% above baseline 2012 levels (index = 100) now 10 long years later.
It was up big time for oil prices in the first half of the year. The low mark for West Texas Crude was the start of January at $76.03 per barrel, and it went up and up from there, ending June at $105.76, for a rise of 39.1%. Of course, high oil and thus gas prices were a key driver of the inflation.
Similar story for US on-the-road diesel prices, which started the year at $3.61, passing the $5.00 barrier in mid-March before reaching a high for 1H at $5.78 the last week of June.
Freight volumes were suprisingly strong. The Freight Tonnage Index from ATA for June was up 7.9% versus 2021, which was the tenth straight year-over-year gain and the largest since June 2018. During the second quarter, the index rose 1.1% from Q1 and 4.6% from the same quarter in 2021.
The Cass Linehaul Index, which tracks per mile truckload contract rates in the US before any fuel surcharge or other accessorial fees, was up 11.6% year-over-year in June, after rising 13.2% versus 2021 in May, as can be seen below.
It was a not good first half for US railroads. Total US carload traffic for the first six months of 2022 was down 0.1% from the same period last year, with intermodal units down 6.2% versus 2021.
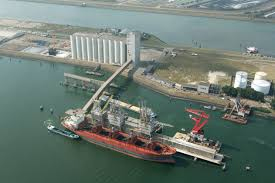
In terms of ocean container shipping rates, the China Containerized Freight Index started the year at about 3250 and ended about the same relative to the cost to ship a container on average out of China, after rising to about 3600 in March. But the cost was really higher than that, with many shippers stlll having to pay high extra fees to get their boxes moved, even as volumes were slowing.
The growth of ecommerce made a surprising turn. In Q1, the most recent number we have, US ecommerce sales were up 6.6% versus 2021 - below overall retail sales growth of 10.9%, continuing a trend of the past four quarters. I also note that Amazon's on-line sales were down 3% in Q1, after falling 1% in Q4 2021.
I have lots more but am out of space. Hope you enjoyed all this.
What is your reaction of 1H supply chain 2022 in numbers and charts? What numbers would you add? Let us know your thought at the Feedback section below.
|