sc digest
 
June 23, 2016 - Supply Chain Flagship Newsletter
border

This Week in SCDigest

bullet State of the Logistics Union 2016 bullet SC Digest On-Target e-Magazine
bullet Supply Chain Graphic & by the Numbers for the Week bullet Holste's Blog/Distribution Digest
bullet Cartoon Caption Contest Continues bullet Trivia      bullet Feedback
bullet New Expert Insight and Supply Chain by Design bullet New On Demand Videocasts
  FEATURED SPONSOR: APEX SUPPLY CHAIN TECHNOLOGIES


Download the Complimentary Case Study:
How “Smart Bins” are Improving Industrial Supply Chains


first thought

SUPPLY CHAIN NEWS BITES


Supply Chain Graphic of the Week
Warehouse Rental Rates Around the World


bullet
Major Acquisition in the Materials Handling Industry
bullet
Direct Foreign in US Manufacturing Soars
bullet
Oil Gains Global Energy Market Share for First Time in Years
bullet
Call Center Soon to be Manned by Robots
   

ACTYLUS™ SMART REPLENISHMENT SOLUTIONS PROVIDED BY APEX SUPPLY CHAIN TECHNOLOGIES


Download the
Complimentary Case Study:
How “Smart Bins” are Improving Industrial Supply Chains


CARTOON CAPTION CONTEST CONTINUES

Week of May 30, 2016 Contest


See The Full-Sized Cartoon and Send In Your Entry Today!

Holste's Blog: Can a Custom Built DC Cost Less Than A General Purpose Building?


ONTARGET e-MAGAZINE
Weekly On-Target Newsletter:
June 22, 2016 Edition


Cartoon, Network Design Questions, DC Rents, BP Energy Report and more


IMPORTANT NEW SUPPLY CHAIN RESEARCH
Supply Chain Software Trends and Opportunities Benchmark Report 2016

From the Search for Greater Agility to the Coming Era of Cloud Software, Where are Companies Headed?


NEW EXPERT INSIGHT
The "-abilities" of Global Trade Management: Product Traceability


by Thomas Ng
General Manager of
Supply Chain Business
Amber Road

SUPPLY CHAIN BY DESIGN
Using Profit Maximization to Minimize Cost


by Dr. Michael Watson

SUPPLY CHAIN TRIVIA

What percent of growth in global energy consumption in 2015 came from emerging economies?

Answer Found at the
Bottom of the Page


State of the Logistics Union 2016


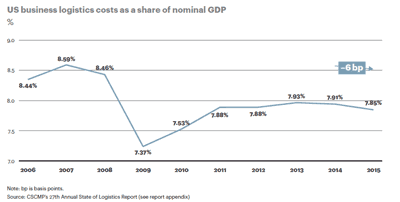
The annual State of Logistics report is just out again with much fanfare from a new lead author and CSCMP, with the headline news that overall relative US logistics costs were modestly down in again in 2015, to 7.85% of GDP, roughly on par with 7.91% in 2014.

Perhaps more importantly, a revision to the data has in fact taken that metric down noticeably from the numbers in previous years. In last year's report, for example, logistics costs were said to be 8.4% of GDP, versus the 7.91% estimated in this year's version.


GILMORE SAYS:

Trucking, for example, is still gaining in share of spend versus rail, while truckload and parcel are gaining share versus LTL.

WHAT DO YOU SAY?

Send us your
Feedback here

I can't find the details as to how and why the data was revised, but the good news is that the report went back and redid the numbers for the last 10 years. While the numbers are now lower by roughly half a percentage point each year than they had been calculated previously - meaning logistics costs are a lower burden on the US economy than previously thought, all told a good thing - the changes in percentage terms year-over-year seem about the same even at the new lower absolute levels, so the big picture of the trends seems mostly unaffected.

The peak year in the past decade - as it was under the previous calculation - was 2007, when logistics costs hit 8.59% of GDP.

I will note in passing that in many years some media commentators have opined that dropping logistics costs as a share of GDP is a bad thing, which of course is nonsense unless you are a carrier or perhaps a 3PL. Countries with immature logistics systems have a much higher share of GDP devoted to logistics than does the US.

All this as consulting firm AT Kearney took over authorship of the report after a competitive bidding process by CSCMP earlier this year. 


This represents the 27th edition of the report, which was launched in 1988 by the late Bob Delaney and sponsored by his company, Cass Information Systems. Somewhere along the way, CSCMP took over the sponsorship, and in the late 1990s Rosalyn Wilson, who has a long career in the logistics industry, began to support Delaney in his efforts. Upon Delaney's passing a few years later, Wilson took on the challenge alone, largely keeping the existing methodology, heading the report until Kearney took on the job for 2016.

Again this year, Penske Logistics funded the report development, and the results were as usual released at a major media event at the National Press Club in Washington DC on Tuesday.


I have not had time to study the report deeply. My reaction after a full read through one time is that (a) this is a much more modern looking and better formatted document; (b) in the end it largely plows the same ground as previous reports, with more polish; and (c) there are a few new wrinkles (e.g., more general commentary beyond the numbers) that I would like to see more of in future years.

In the executive summary, the report notes that US business logistics costs (for which we now get the new acronym USBLC), grew by an average of 4.6% annually between 2010 and 2014, fueled mainly by 5.5% annual growth in transportation costs. Keep in mind the report deals exclusively with nominal costs, not so called "real" changes that are adjusted for inflation.


So, simple to say, harder to calculate, you take the number for US logistics costs and divide it by annual nominal GDP numbers and voila, logistics costs as a percent of GDP emerges. The methodology must use nominal GDP as the denominator because the costs for the year are compiled in nominal terms.

The growth in USBLC, however, slowed to just 2.6% in 2015, with transportation costs - the largest single component of USBLC - up by only 1.4% in 2015.That transport cost decline was caused by a combination of lower oil prices (down some 30% over the year), which decreased fuel surcharge expenses sharply across all modes, and softness in freight volumes across all modes except parcel.

The total cost of US logistics was estimated at $1.408 trillion for 2015, up $30 billion or so in 2014 under the new calculation. A lot of elements go into that number, from warehouses to trucking to pipelines, but the three main categories are inventory carrying costs, including the costs of warehousing (30.3% of the total logistics spend in 2015), transportation costs (63.2%), and administrative costs, mostly related to spend on freight forwarders and logistics IT spend not otherwise captured in the other two categories (just 6.4% of the total).

Within transportation, trucking-related spend (including private fleets but excluding parcel) comprise 65.4% of total transport costs and 41.3% of total logistics spend. Parcel was broken out for the first time this year as a separate cost category, estimated at $82.2 billion in total, or 9.2% of transport costs and 5.8% of total logistics.

At $80.7 billion in 2015, rail comprises 9% of transportation spend and 5.7% of the total logistics costs. 


One thing I cannot find in this year's report that I liked in the past was a breakdown between “local” versus “intercity” transport costs - not sure if it is just gone or buried somewhere I haven't found yet.

In terms of growth in spending by these various categories, the 5-year average annual growth rate in costs by mode or cost category is as follows, according to the report:

Truckload: 7.1%
LTL: 3.8%
Private/dedicated fleet: 5.8%
Trucking combined: 5.9%
Parcel: 6.7%
Intermodal: 2.1%
Rail total: 3.8%
Air freight: 4.6%
Inventory carrying/warehouse costs: 2.6%


I cannot find the specific number in the report, but because logistics costs as a percent of GDP over the past five years has basically been flat, and five-year growth of USBLC has averaged 4.6%, nominal GDP must have been rising at right around that same level. So, you can compare the growth in each cost type versus 4.6% GDP growth to see what modes/categories are gaining share and which are not.

Trucking, for example, is still gaining in share of spend versus rail, while truckload and parcel are gaining share versus LTL. I am very surprised intermodal costs have been averaging less than GDP or overall logistics spend growth. Inventory carrying costs are falling, primarily as the result of lower interest rates (though those rates were up a bit in 2015) even as total inventory levels have been rising until flatlining in 2015, and warehousing costs are about flat with GDP growth at 4.7% over the last five years.

The report has a lot more detail on each mode and cost bucket, as well as the overall economic and logistics environment, which I don't have room for here.

The 2016 report did add a new commentary type section at the end, which discussed the looming impact of new generation technologies such as robotics, drones, Uber-like services, autonomous vehicles and more, and noted that the adoption of these technologies - and therefore logistics progress - will be tremendously impacted by the larger governmental and regulatory environment.

It lays out four scenarios, from one it calls "Cruisin' Down the Highway," in which the market rules and regulations are light, to "Dead End Street" at the other end of the spectrum, in which regulators strongly impede progress, with two other more moderate scenarios in-between.

What will it be? I am guessing one of the two middle versions, honestly, based on what we are seeing already (e.g., this week's new and very limited rules on air drones for deliveries from the FAA). The wild card would be if some other nations (e.g., India) take a more open approach and make great progress, perhaps forcing the hands of more heavy-handed countries.

So, some different, some much the same in the new State of Logistics Report, though I would say a change for the better for sure. I would like to see a bit more commentary on what the data as a whole is telling us, beyond all the detail for individual cost buckets, as just one comment, but I am sure we will see improvements over time after this solid inaugural edition under AT Kearney's stewardship.

CSCMP members can already download a copy for no charge.

Any reaction to our summary of this year's State of Logistics Report? Do you like the new style?  How could it be improved? Let us know your thoughts at the Feedback section below.


View Web/Printable Version of this Column
   

New On Demand Videocast:


Supply Chain Design as a Continuous Business Process - The Whirlpool Story


From Project to Process: Here's How to Get It Done


In this outstanding Videocast, we’ll explore the changes needed to make supply chain design a continuous process, emerging new best practices in supply chain design, and how consumer products leader Whirlpool has successfully embraced this 360-degree approach.


Featuring Dan Gilmore, Editor, SCDigest, and Toby Brzoznowski, Executive Vice President, LLamasoft and Brian Streu, Manager, Supply Chain Design, Whirlpool

Available On Demand Soon

New On Demand Videocast:


A Benchmark Study on Supplier Integration in an Outsourced World

Featuring Real World Experiences from DuPont, Honeywell and Acsis, Inc.

A new benchmark study of practitioners reveals the priorities, expectations and challenges of achieving real-time visibility into goods as they move through third-party production cycles.


Featuring Dan Gilmore, Editor, SCDigest, and John Dipalo,Chief Strategy Officer, ACSIS, Peter Musser, IT Services Delivery Specialist, DUPONT and Bruce Stubbs, Director, Industry Marketing Honeywell Scanning & Mobility


Now Available On Demand

On-Demand Videocast:


Now is Finally the Time for WMS in the Cloud


As Supply Chain Software Moves to the Cloud, Barriers to Warehouse Management Joining the Party have All Fallen Away


What has changed, and what WMS technology developments are fueling this transition. We'll cover all that and more in this detailed, fast-paced broadcast.


Featuring SCDigest editor Dan Gilmore and Dinesh Dongre, VP Product Strategy, Softeon


Available On Demand

YOUR FEEDBACK

Ok, our last set of some of the many emails we received on our coverage of Lessons from Finish Line's Distribution Disaster. Many great responses.


Feedback on Lessons from Finish Line's Distribution Disaster:

comma


Nothing said yet in all the feedback about Change Management? Everyone has to be on board as to why the new systems are being implemented, and benefits it will provide.

Mock go lives? Also a best practice.

Finally, accountability. Everyone, not just project members and business leaders. Annual Performance reviews should have individual metrics and goals tied to metrics and goals of the project. A great way to get everyone on-board, or maybe looked at another way, "Get on the bus, or get out of the way!"

Very interested to see "the rest of the story".

Mark Shuda

comma
 
 
comma

I noted the consultant, you first referenced, called out the issue of "buy-in" from the company personnel who would be responsible to implement and operate the new facility and systems. To put it simply - BINGO!

As a retired supply chain executive and consultant, I can tell you our most significant challenge every single time we were standing up a new facility and system for a client was the full buy-in of the company personnel (from CEO to Order Picker in the warehouse) to the new program.

Supporting that buy-in had to be adequate funding, a detailed implementation plan with a reasonable schedule and accountability assigned plus the development of a comprehensive training plan for all (throughout the company) with close monitoring and mentoring before, during and after startup. These were essential elements of a successful project. If we could not get that understanding with a client, we walked away.

James Nelson

comma
 
 
comma

Wow, lots of painful and happy memories from earlier in my career when I did hundreds of these systems implementations.

Regarding the comment of Tompkin’s Kevin Hume on WMS/DOM implementation. The fact that Finish Line was implementing DOM suggests that they have multiple DC’s. DOM is a overlay concept to manage customer order distribution across multiple distribution points, and in my opinion should not be implemented until the DCs are running correctly. Plan and lay the groundwork for DOM as part of the WMS, but do the WMS first.

Sound like FL went "big bang" across the full business. I would have chosen 1-2 pilot locations to prove the WMS before going big. Pilots should have been first in a smaller DC which could easily be controlled and less impactful if there were failures, then a larger DC to prove scale – both would provide valuable learning experience and tools, and the opportunity to work out the kinks before bringing the business to its knees. Having a sound WMS running in one-two facilities will help "sell" the value of the system to others (convincing folks to change is always a bugger).

Steven R. Murray
Consultant

Supply Chain Visions


comma I was lucky enough to not be part of FinishLine project (yes, I can say that again! I have not heard horror stories from those who were on the project, but none of them wanted to stay on it for long).

I have been on several projects that do it all wrong to start with.

At times, it is a company's own employees (on functional side) or sometimes it is IT team , and in many instances, it is the System Integrator or the Software Vendor at fault - and in the ones where distastes are biggest, it is a typically a joint effort.

Since I am typically on the Software Vendor side, here is what I have seen in close quarters:

1. Consulting Managers typically are afraid to give bad news to client.

2. They keep harping on their own team of consultants to get it right (no matter who may be wrong and how hard the consultants try, they can't get it right because of other variables on the project).

3. After a certain point (go live is pushed 4 times, and if the Software Vendor is not making any money - typically fixed fee projects in today's world) - every one starts cutting corners - take knowledgeable resources to profit making projects, put newbies in.

4. Vendors stop proposing changes to the project - which may bring right functionality, because they know that client is not ready to pay for it and if they propose it, it may have to do it for free.

Chirag Sanghavi


comma

SUPPLY CHAIN TRIVIA ANSWER

Q: What percent of growth in global energy consumption in 2015 came from emerging economies?

A: Astoundingly, 97%, led by China and India, according to the Statistical Review of World Energy 2016 just released as usual by BP. OECD country consumption saw only a slight rise.

© SupplyChainDigest™ 2003-2016. All Rights Reserved.
SupplyChainDigest
PO Box 714
Springboro, Ohio 45066
POWERED BY: XDIMENSION