 |
July 16, 2015 - Supply Chain Flagship Newsletter |
 |
| FEATURED SPONSOR: ZEBRA |
||
 |
||
Download Our Complimentary White Paper Now To Learn the Ten Steps to Finding the Right Mobile Device |
 |
|
|||||||||||||||||||||||||||||||||||||||||||||||||||||||||||||||||||||||||||||||||||||||||||||||||||||||||||||||
As we noted last week, the US and global economies were weak in Q1, with US real GDP growth of -0.2%, the Euro zone a bit better but still lousy at +1.0%, and world GDP growing just 2.2%, according to the IMF - also weak. The second quarter and full 2015 numbers are expected to be better (2.5% for US for the full year, 3.3% for the world), but both those numbers are down from forecasts in April. One might have expected global economies to be stronger given that world oil prices remained highly depressed.
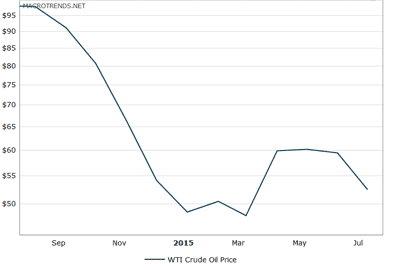
As can be seen in the chart below, prices for US West Texas Intermediate fell from about $98 per barrel at the end of last summer to under $50 by year's end, and largely stayed that way for the first three months of the year.
They jumped a bit in April and May, but still to just $60 or so, still very low by recent standards, before slumping again since then. Continued growth in US production, and now likely new output from Iran hitting the market, make it unlikely oil will move much higher for some time, barring some significant external event.
|
||||||||||||||||||||||||||||||||||||||||||||||||||||||||||||||||||||||||||||||||||||||||||||||||||||||||||||||||
The good news is that US diesel prices have finally started to respond to the oil cost decreases since they began last Fall. On the road diesel prices began the year at $3.13 per gallon, but are now sitting at about $2.81 cents, a drop of a little more than 10% from January.
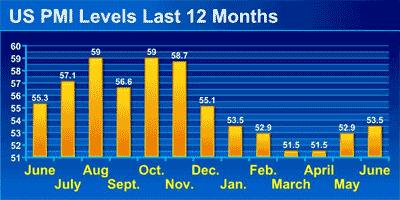
Turning now to manufacturing, the US Purchasing Managers Index, which measures manufacturing activity, has been above the 50 mark that separates expansion from contraction for 30 consecutive months through June. However, as can be seen in the chart below, the last six moths of 2014 were 3-5 percentage points above the levels in the first six months of this year. So, we still have manufacturing growth, but it is slowing.
The new orders index - a barometer of future manufacturing activity - has been positive for 31 consecutive months, and interestingly has been running stronger than the overall PMI, coming in for example at 56.0 and 55.8 in June and May, respectively, although in general also down a bit from levels seen in the 2H of 2014.
The PMI data was generally consistent with manufacturing production levels as reported each month by the Federal Reserve.
Note we refer here specifically to manufacturing output, not the broader measure of full industrial output, which includes mining and utilities.
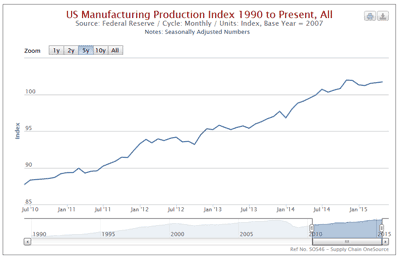
As can be seen in the chart below, the Federal Reserve data is even more lukewarm than the PMI scores. The scores each month reflect an index, in which the baseline year (index = 100) comes from the recent peak manufacturing year of 2007 (average of all months that year). The index started to decline in 2008 in the early days of the recession, ultimately reaching a bottom in June of 2009, when the index fell all the way to about 80, among the lowest scores on record. It was a slow but steady climb since then, but it took six years to get back to those 2007 production volumes, with the index finally reaching a score of 101.7 in July of 2014. The good news is that it has stayed above that 100 mark ever since. The bad news - it has also flatlined, running in a range of 101.3 to 101.9 over the last 12 months, with very little growth over that period. That includes a score of 101.7 for June, flat with the May number, meaning output last month was 1.7% above those average 2007 levels, and up just 1.8% over June 2014. |
||||||||||||||||||||||||||||||||||||||||||||||||||||||||||||||||||||||||||||||||||||||||||||||||||||||||||||||||
Turning to some logistics topics, US truckload rates were in generally well up from in 1H 2015 versus the previous periods in 2014, but flat or down from the last part of 2015.
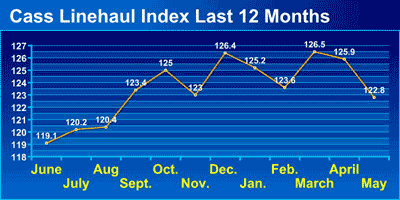
As can be seen below, the index ended 2014 at a value of 126.4, continuing a strong upward pattern that began in March and meaning per mile rates were 26.4% above the baseline month of January 2005. But in the first five months of this year, rates have generally trended down a bit from year end, though still well up over the months in 2014. However, that gap has been shrinking.
US freight volumes were up a fairly strong 3.7% through May versus the same period in 2014, according to the American Trucking Association's Freight Tonnage Index, which reached an all-time high of 135.8 in January. That means tonnage was up 35.8% versus the average volumes in the baseline year of 2000. That's actual very modest annual growth over 14 years.
On the rail side, volumes were weak compared to most recent years, with normal railcars volumes for the first half actually down 3.9%, partially attributable to continuing shrinkage of coal volumes, but even the normally fast growing intermodal side saw increases of just 2.7% in the first half.
Global trade growth continues to trend down, with the World Trade Organization revising its forecast in April to growth of just 3.3% for 2015, down from 4% previously. The heady days of 5% or more growth are simply gone. But that number would actually be up from 2014, which was the third straight year of global trade growth of under 3% - a quite astonishing situation, actually.
But that didn't stop the US trade deficit in goods with China from continuing to rise. It was at about $140 billion through May, versus $125 billion through the same period last year. That's an increase of 12%. So much for reshoring. The cumulative US trade deficit with China in goods since 2000 is now some $3.4 trillion, and still on the increase year over year, every year.
The growth of ecommerce sales rolled on, up another 14.5% in Q1, according to the Census Bureau. Defying the law of large numbers, Amazon.com's North American merchandise sales were up an incredible 31% in Q1, more than double the overall ecommerce growth rate as it continues to gain share.
There is so much more, but I am way out of space. Hope you enjoyed it.
Any reaction to our review of supply chain 1H 2015 in numbers and charts? Anything stand out? Let us know your thoughts at the Feedback button or section below. |
||||||||||||||||||||||||||||||||||||||||||||||||||||||||||||||||||||||||||||||||||||||||||||||||||||||||||||||||
|
||||||||||||||||||||||||||||||||||||||||||||||||||||||||||||||||||||||||||||||||||||||||||||||||||||||||||||||||
|
||||||||||||||||||||||||||||||||||||||||||||||||||||||||||||||||||||||||||||||||||||||||||||||||||||||||||||||||
|
|
|
YOUR FEEDBACK
We received some nice letters based on our "unplugged" interview with John Hill. You will find several of them below.
Feedback on Interview with John Hill:
I am one of those Logisticon alumni. I started there after John left but Dave Scott was still there. I met John later at a DC Expo, probably in 1997-98 when I was a research director at Gartner. Dave was a great mentor to me in the WMS business. Ron Tepper at RGTI was another great mentor. John helped me gain credibility as that first Gartner analyst. I was there at Logisticon when those "unusual conditions" occurred and led to the company's collapse. But as you said in your article, someday we can talk about that. Keep up the good work Tom Ryan |
||
I had the pleasure of working on the same team as John Hill for several years at Esync (and later Transystems) and I have to say - in my book, John Hill is a true hero in the supply chain industry. John is not the big-ego consultant type of guy - just the opposite in fact. John has always been generous with his time, especially with younger people seeking to learn from his experience. I would summarize by saying that John Hill serves as an inspiration for those of us who aspire to be leaders in the logistics and supply chain industry and it has been nothing short of a pleasure to have the opportunity to work with John in the brief time that I had that opportunity. Marc Wulfraat |
||
Many thanks for the update on John Hill and his fine work. It reminded me of a paper I put together a few years ago and I have included a checklist regarding logistics systems implementation from it, which I believe has also withstood the test of time. 1. Rigorously assess the business needs in the beginning; agree it with all concerned, and keep it updated in relation to the project. Even a simple SWOT analysis is better than nothing, and will keep the project properly focused. I look forward to hearing more about John and in particular about his "lost" WMS+ model. In the 80's I was working on a system that contained a sales database that could support strategic distribution centre modeling, tactical fleet disposition and daily truck scheduling. It held actual sales data by line item to every sales outlet and their profitability, production, transportation, warehousing and inventory costs. We made it as far as getting each component system to work but were never able to join it all up together before I left for other challenges. If any of this is of any interest please let me know. David MacLeod |
||
SUPPLY CHAIN TRIVIA ANSWER
Q: What was the Unimate?
A: The first ever industrial robot, deployed on a GM production line in 1961. It took die castings from machines and performed welding on auto bodies.
| © SupplyChainDigest™ 2003-2015. All Rights Reserved. SupplyChainDigest PO Box 714 Springboro, Ohio 45066 |
POWERED BY: XDIMENSION
|


