 |
January 24, 2014 - Supply Chain Flagship Newsletter |
 |
| THIS WEEK'S SPONSOR: MHI |
 |
The Greatest Supply Chain Show on Earth |
 |
|
|||||||||||||||||||||||||||||||||||||||||||||||||||||||||||||||||||||||||||||||||||
The Year in Supply Chain in Numbers and Charts
|
||||||||||||||||||||||||||||||||||||||||||||||||||||||||||||||||||||||||||||||||||||


| GILMORE SAYS: |
"Freight spend was in general up in the year despite flat shipment volumes, which in part resulted from a small uptake in weight per shipment but also modest upward rate pressure as carriers maintained asset discipline again." WHAT DO YOU SAY? |
So here we go.
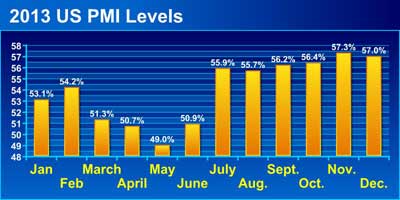
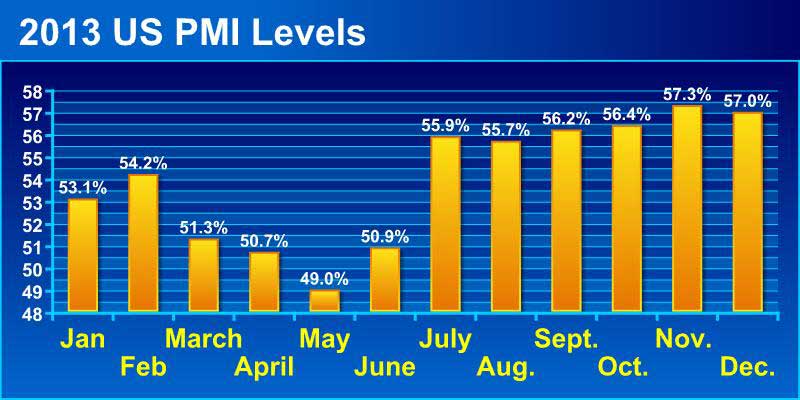
In the face of again a middling US economy in 2013 (with good news for Q3), manufacturing was very much a bright spot in the US economy during most of 2013. The Purchasing Managers Index, which measures manufacturing activity, was modestly above the 50 mark that separates expansion from contraction January through April, then hit a real lull in late Q2 (which has been a trend in recent years), before finishing the year with a bang.
As shown in the chart below, the PMI was above the 55 level July through December, finishing the year at 57. The new orders index has even been stronger of late. Will this carry into 2014? We'll see.
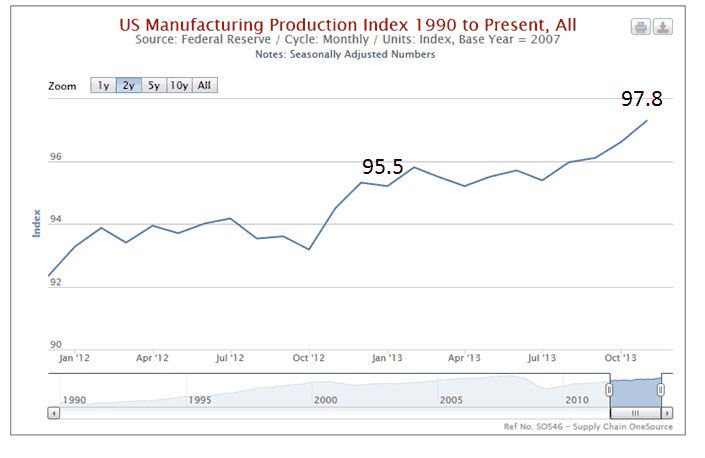
US production levels are finally starting to evidence that there really is some level of a resurgence in US production. The US manufacturing output index from the Federal Reserve reached a level of 97.8 in December, its highest mark since the start of the recession, after beginning the year at 95.2, as shown in the chart below.
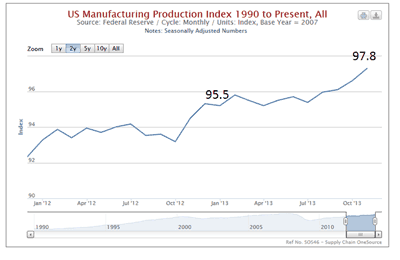
That still leaves US output 2.8% below the peak and baseline year of 2007, but we are getting very close. There are huge differences by sector though, with industries such as autos, food and believe it or not electronics well above 2007 levels, while chemicals (surprising), furniture and consumer durables are lower today than in 2007, in some cases significantly so.
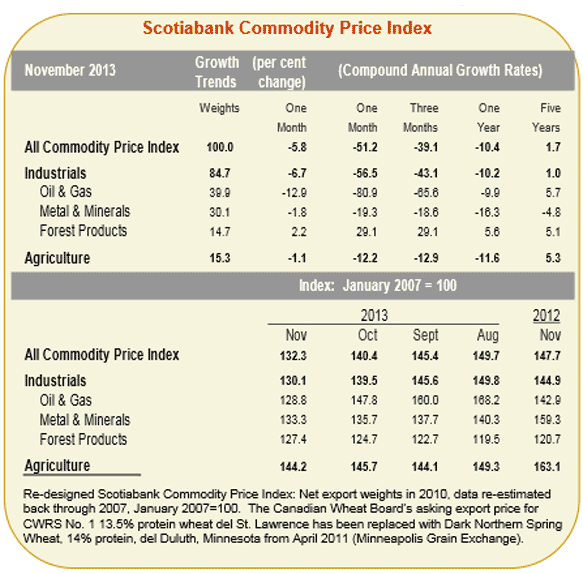
I referenced two weeks ago that the commodity price bubble has been popped in a big way, and you will find a graphic here from Scotiabank of Canada on its commodity price index for November (most recent), that supports than claim.
For 2013, the index's basket of several commodity areas was down 10.4%, with only forest products up for the year. Metals were down 16%. The average annual growth rate for the full index over the last five years is a measly 1.7%. Quite a stark change from pre-2008, though the price of some foods have been again on the march more recently.
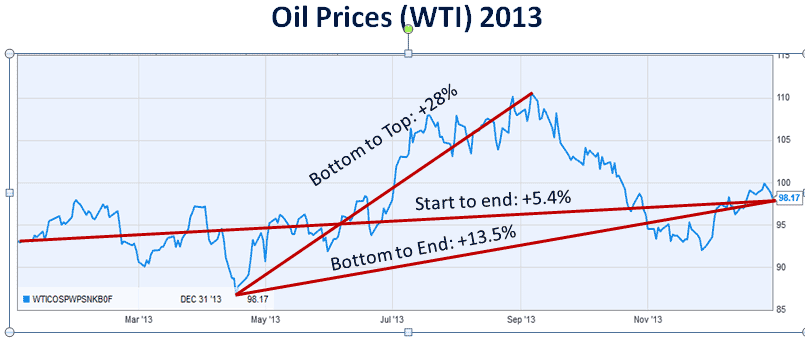
Oil prices were up modestly in 2013, about 5% for US West Texas crude, but as usual there was a lot of volatility throughout the year, with the highest price per barrel for the year ($110.62) in September some 28% above the lowest price ($86.50 in April).
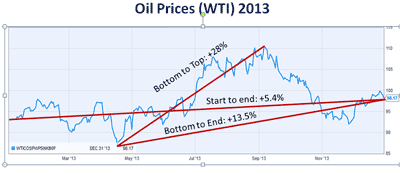
Despite that, on the road diesel prices remained virtually flat, with a high of $4.15 per gallon in April and a low of $3.81 in July - I would have thought there would have been more volatility consistent with oil price changes.
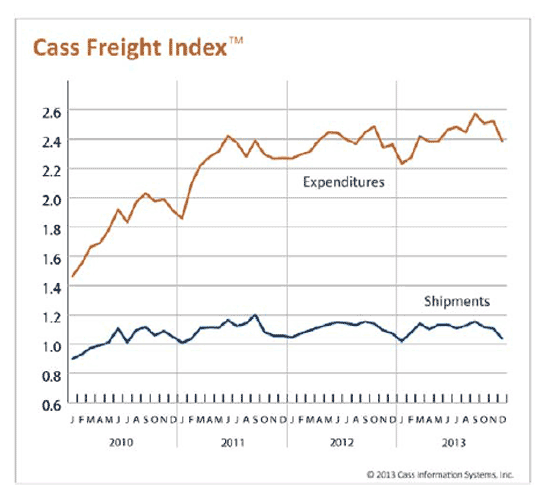
There was conflicting data on freight movements in 2013, with the ATA freight tonnage index generally showing strong growth and reaching record levels in late summer/early fall, while the Cass freight index reported flat US volumes. I need to get to the bottom of this discrepancy.
But as shown in the Cass chart, freight spend was in general up in the year despite flat shipment volumes, which in part resulted from a small uptake in weight per shipment but also modest upward rate pressure as carriers maintained asset discipline again
US intermodal carload growth was up 4.6% in 2013.
Global trade growth continues to shrink, surprising to many of us, falling to just 2.1% in 2013, according to the United Nations. What a change from the 5-6% or so annual growth commonly seen prior to the recession. Growth rates in the emerging markets economies heavily targeted by large businesses are also slowing, in part due to the drop in commodity prices - meaning the extreme hope many multinationals have in finding salvation in emerging markets may turn out to be misplaced.
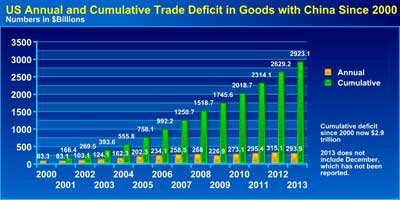
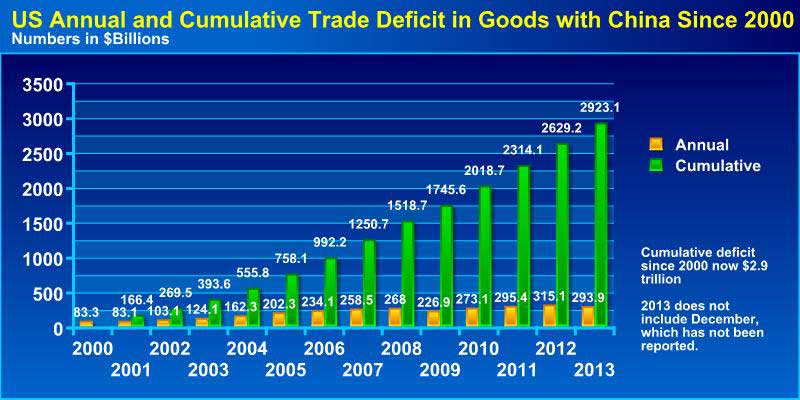
The US trade deficit in general shrunk a bit last year, based on modestly growing exports and a sharp reduction in oil imports due to surging US energy production, but is still large in absolute terms, running some $35-40 billion per month. But nearly all of that can be explained by the US trade deficit in goods with China, the growth of which slowed in 2013 but will still for the year exceed 2012's record of $315 billion when the December numbers are released.
The cumulative US trade deficit with China in goods since 2000 is some $2.9 trillion, as shown in the graphic below.
The pace of internet sales have slowed a bit, but is still far outpacing increases in brick and mortar sales. The last few quarters saw year-over-year growth in the 9-10% range, down from 13-15% in recent years, and ecommerce comprised about 16% of Christmas season sales. Obviously, that percentage is much higher in various product categories.
Amazon's growth has also slowed, as it faces the law of big numbers, but it still cranked out revenue increases in the low to mid 20% range in 2013, and will end the year with revenue close to $80 billion when it reports at the end of the month.
I have lots more but am out of space. Also see our 2013 supply chain timeline of the year's top stories and events.
Any reaction to our review of supply chain 2013 in numbers and charts? Let us know your thoughts at the Feedback button or section below.
| View Web/Printable Version of this Page |
|
|
|


YOUR FEEDBACK
We received some immediate feedback on our story this week on Amazon's new patent on something it calls "speculative shipping." Here are a few good ones below.
Feedback of the Week: On Amazon's Speculative Shipping
It is a brilliant concept. I would speculate that it could be somewhat manipulated with focused advertising. If an ad campaign was focused on an area with direct mail, billboard, internet radio, Internet TV, Amazon could effectively spike the demand and deliver a "wow" with the quick delivery having had product ready.
Of course it might also feed the conspiracy theorists' belief we're all being controlled by the internet. Michael B. Huss |
||
| More on Amazon Speculative Shipping: | ||
I think Amazon's Speculative Shipping is one step towards winning the battle in 'Last Mile advantage'. Today in the increasing competition in the e-commerce space, delivery has become an essential factor after pricing and assortment. This strategy from Amazon, if successfully implemented would help in same day delivery with an premium charge. Proper forecasting would actually allow Amazon to distribute the products at relevant geographic regions, reduce the delivery times significantly and increasing the customer satisfaction.
|
||
I think this is an innovative concept which needs to be seen how successful it is once it gets implemented. Sudhanshu Raj |
||
SUPPLY CHAIN TRIVIA ANSWER
Q: What was the top year for women working in US shop floor manufacturing jobs as a percent of the total, and what was the percentage?
A: 1990, and just over 32%. Labor Dept. statistics show a big drop since then, down to just 27% currently.
| © SupplyChainDigest™ 2003-2013. All Rights Reserved. SupplyChainDigest PO Box 714 Springboro, Ohio 45066 |
POWERED BY: XDIMENSION
|