For the last several years, I have been doing reporting and analysis based on the annual Working Capital Scorecard that had been published by CFO magazine based on data compiled by REL, a division of the The Hackett Group.
My work on this has focused on the inventory part of the working capital equation - more on that in a moment. This year, however, the data available from CFO magazine was a bit limited, and The Hackett Group shared the numbers with me directly - and it is very interesting as always. The just released 2011 data is based on year-end 2010 financials from hundreds of US public companies.
| GILMORE SAYS: |
"Restaurants and pharmaceutical companies topped the performance list, both dropping DIO measures by 16%. Conversely, textile/apparel companies and network/communications equipment providers saw the biggest increases in DIO."
WHAT DO YOU SAY?
Send us your
feedback here
|
While I think my previous reports on this data have been good, I have not been completely happy with the results, in part because of the way the data has been organized by REL. Some of the sector groupings REL uses didn't really work either generally or from an inventory-specific perspective, but I have let that slide in the past , mostly out of necessity. For example, home builders like Toll Brothers were mixed in the household durables category with companies like Whirlpool. That may have been the most "apples and oranges" combination, but there were a number of others that didn't quite jive, at least from a supply chain perspective. So this year we took the effort and sorted the data in ways that we think made a bit more sense when looking at inventory levels. That primarily involved removing a number of companies from different sector groupings (e.g., taking the mining companies out of the Metals and Mining category so that it becomes just metals producers). We also looked at Specialty Retailers as a whole, but then broke them down into sub-sectors, such as apparel, auto parts, office supplies, etc.. Finally, and importantly, REL has historically always used the median score when reporting on each sector; we decided instead to look at the average, I think to the better.
Working Capital is something of a strange term, as it sounds like a good thing. But it isn't as defined here - money tied up in working capital is cash that has to be borrowed or cannot be put to better use in the business. Working capital has three components: Days Sales Outstanding (how fast a company collects its money); Days Payables Outstanding (how fast - or slow - a company is to pays its suppliers; and Inventory levels (how much cash is tied up in inventory).
The study as always measures inventory using Days Inventory Outstanding, meaning how many days of sales is the company holding in inventory, and which it defines as:
End of Year Inventory Level/[total revenue/365]
As such, it is sort of the reverse of inventory turns, in that a higher DIO, all things being equal, means poorer inventory management performance, while a lower number signals improvement.
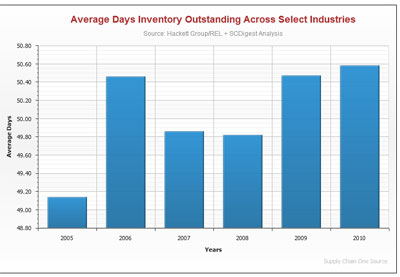
Looking at the data across all the three dozen or so sectors we picked from the REL data, below you will find changes in the average DIO from 2005 to 2010. (Savvy readers clicking to view the full sized image may get some idea of one of the exciting developments we have going on here that I referenced in a few columns ago).
View Full Size Image
The chart perhaps somewhat exaggerates the level of change based on the Y-axis range, but the low as an average DIO of 49.1 in 2005 to a high of about 50.6 just last year. That's about a 3% swing from low to high - and I wouldn't have guessed 2010 would have been the high water mark. Some have said that with the cost of borrowing so cheap and the cash on the balance sheet so high for many companies that they just haven't been that focused on inventory reduction in the last 12-18 months. Maybe so.
Now below you will find the 2010 numbers and changes from 2009 in each sector, again using an unweighted average.
- Aerospace and Defense: 67.9 from 64.6 in 2009
- Auto Parts and Components: flat at 33.1
- Auto OEMs (Ford, GM, Harley-Davidson): 26.3 from 27
- Beverages (beer and soft drinks): 24.3 from 22.8
- Biotech: 57.6 from 56.9
- Building Products: 46.0 from 40.9
- Chemicals: 53.4 from 56.8
- Communications and Networking Equipment: 28.7 from 25.3
- Computers and Peripherals: 31.7 from 35.0
- Containers and Packaging: 44.7 from 42.2
- Electrical Equipment (e.g., Emerson Electric, AO Smith): 55.7 from 55.9
- Electrical Equipment, Instruments and Components (e.g., Corning, Avnet): 46.5 from 44.0
- Food and Staples Retailing (grocery and drug stores): 31.1 from 29.8
- Food Manufacturing: 40.3 from 37.0
- Healthcare Equipment and Supplies (e.g., Becton Dickenson, Stryker): 49.8 from 50.0
- Household Durables Whirlpool and others): 56.7 from 53.9
- Household Products (consumer package goods): 51.3 from 47.7
- Industrial Conglomerates (e.g., 3M, GE): 45.2 from 44.6
- Internet/Catalog Retail: 20.3 from 19.2
- Leisure Equipment, Toys (e.g., Mattel, Eastman Kodak): 51.8 from 46.7
- Life Sciences (e.g., Bio-Rad, Thermo-Fisher Scientific): 48.6 from 47.3
- Machinery (e.g., Caterpillar, Illinois Tool Works): 59.1 from 59.5
- Metals Manufacturing (US Steel, ALCOA): 64.9 from 74.6
- Multi-Line Retail (mass merchants and dept. stores): 62.0 from 61.3
- Office Electronics (a category of two – Xerox and Zebra Technologies): 30.1 from 29.0
- Paper and Forest Products: 49.7 from 49.4
- Personal Products (e.g., Avon, Estee Lauder): 34.2 from 33.1
- Pharmaceuticals: 44.7 from 53.3
- Restaurants: 4.9 from 5.2
- Restaurants not including Starbucks, which has much higher DIO than all others: 3.6 from 3.9
- Semiconductors and Equipment: flat at 45.0
- Specialty Retail All Companies: 60.6 from 59.7
- Specialty Retail Apparel: 49.9 from 48.3
- Specialty Retail Auto Parts: 126.4 from 128.2
- Specialty Retail Electronics and Home Products (Best Buy, Home Depot, William Sonoma): 58.0 from 58.1
- Specialty Retail Office Products (Staples, Office Depot, OfficeMax): 39.0 from 37.5
- Specialty Retail Other (Cabelas, PetSmart, others): flat at 86.5
- Textiles, Apparel, and Luxury Goods: 61.7 from 53.1
- Tobacco: 65.6 from 74.6
- Trading Companies and Distributors (e.g., Grainger, Kaman): 69.4 from 72.8
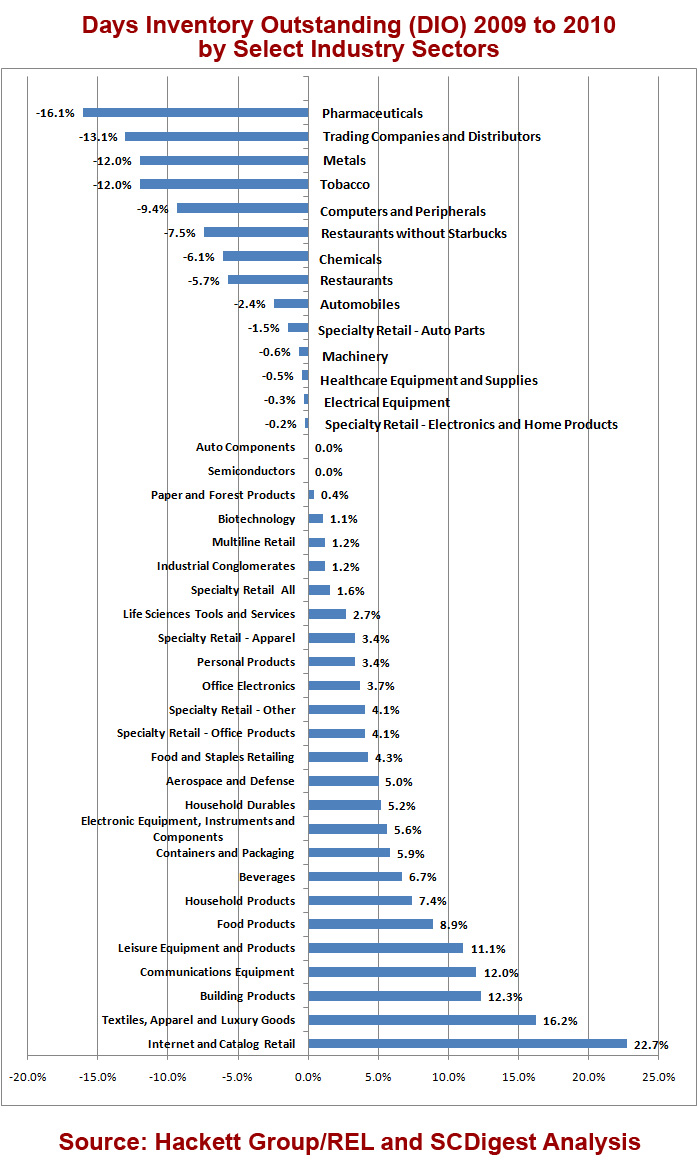
We then took those year over year changes, and sorted them by percentage change, again with negative numbers meaning the greatest improvements from 2009 to 2010.
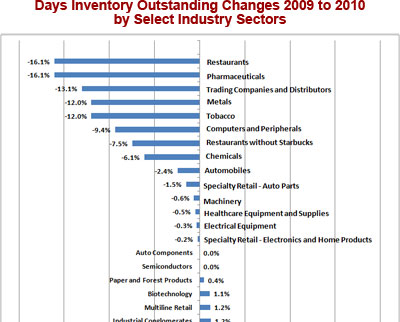
View Full Size Image
As you can see in the full size image, restaurants and pharmaceutical companies topped the performance list, both dropping DIO measures by 16%. Conversely, textile/apparel companies and network/communications equipment providers saw the biggest increases in DIO.
We're out of room. Look for an even more in-depth analysis and commentary in our On-Target Newsletter early next week.
Any reaction to these inventory numbers. Are you surprised in the overall rise in company inventories in 2010? Anything else jump out at you? What further analysis would you like to see? Let us know your thoughts at the Feedback button below.
|


 Holste's Blog: