Risk management remains one of the top supply chain imperatives in most large and some mid-sized companies. It also remains a discipline that is not well understood, and there is little of what you might call accepted wisdom as to how to get this right.
I say that because I still see lots of presentations where the speaker offers a 2 x 2 matrix showing disruption risks mapped on two dimensions: size of impact and likelihood of occurrence, with high-low positioning for each dimension. So naturally enough, risk that are high impact and high perceived likelihood are those that will receive real management attention.
I have seen some variations on this, such a 3 x 3 matrix where there is a "medium" category added for each dimension, or another version where each dot is color-coded to indicate how fast the impact of a disruption would be felt, among other takes on this same basic model.
Gilmore Says: |
 If I haven't lost you yet, when time-to-survive exceeds time-to-recovery at all nodes, you have a very robust supply chain indeed from a risk perspective. If I haven't lost you yet, when time-to-survive exceeds time-to-recovery at all nodes, you have a very robust supply chain indeed from a risk perspective.

Click Here to See
Reader Feedback
|
None of this especially scientific. Such an approach certainly doesn't give much guidance about how much to spend in the cause of mitigating any particular risk of a disruption. And it doesn't deal well at all about risks that are impossible to predict, from a tsunami in Asia to a factory fire at a key supplier.
In early 2012, Dr. David Simchi-Levi of MIT unveiled his new Risk Exposure Index (REI) for the first time publicly on a Videocast on our Supply Chain Television Channel. This of course was not long after a couple of major supply chain disruptions the previous year: the earthquake and tsunami in Japan and months-long flooding in Thailand.
Both those events played major havoc on many automotive and high tech supply chains, and led to one of my favorite supply chain quotes of all-time, when the head of procurement for Toyota and its renowned supply chain stated: "Our assumption that we had a total grip on our supply chain proved to be an illusion."
Earlier this week, we produced another Videocast updating major progress with the REI over the last three years, and the award winning success Ford has had with the program. I say award-winning because Simchi-Levi and Ford recently won the prestigious Wagner Award from INFORMS, the leading professional association for operations research and analytics, beating out finalist entries from companies such as Intel and Procter & Gamble.
In a touch of irony, on the way to film that broadcast the big news on the car radio in my neck of the woods was that GE's building 6 at its giant appliance factory park in Louisville, KY was burning to the ground. How's that for a supply chain disruption.
I cannot do justice to all that was covered in this broadcast in one column, so I am going to try to pick out some highlights. You can now watch the full broadcast one demand here: The Risk Exposure Index 3.0 - the Ford Story.
Key to the approach are a couple of concepts. One is time-to-recovery (TTR), which determines how long it would take a node in the supply chain (in-house or of a supplier) to effectively get back full functionality after a major supply chain disruption. So, for example, even if a supplier has another facility, it probably will take at least a couple of weeks to get the added production from an alternative site. In other cases, as Toyota found out, the TTR could be months.
Once you understand TTR, you can then calculate the performance impact (PI) from such a disruption, either in hard dollars from lost sales or longer term hits to market share and reputation.
Finally, new at least to me on this year's broadcast, we add to that time-to-survive (TTS), which basically measures how long existing inventories would hold out before a disruption would start to impact supply capabilities.
So if I haven't lost you yet, when time-to-survive exceeds time-to-recovery at all nodes, you have a very robust supply chain indeed from a risk perspective.
Of course, you might respond that this sounds like you get there by just loading up on inventory to increase TTS, sort of anathema generally and especially in a Lean-focused culture at Ford and others in the auto sector. Well, partly yes, if not "loading up" on inventory then at least strategically boosting levels where it makes sense to reduce risk - in an objective way. And importantly, recognize that the same objective (TTS > TTR) can also be achieved by working to reduce time-to-recovery with current inventory levels. Often, it would be some balance.
So what Simchi-Levi has now done at Ford and elsewhere is a create a system that links component bills of materials to finished products and profit margins and what supplier sites feed which Ford assembly sites and specific makes and models. That enabled the system to calculate the performance impact from a disruption at some 1400 suppliers across 4500 of their production sites.
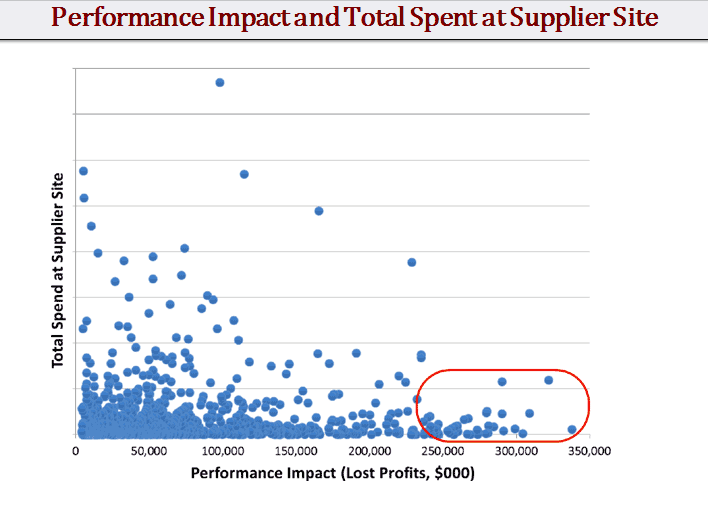
One result of this analysis is shown in the graphic below, which plots performance impact from a disruption at each supply node against the amount Ford spends with each facility.

Source: David Simchi-Levi
Notice that there is a cluster of sites where the performance impact from a disruption is very large, but Ford's spend is very low. This is a crucial point, and frequently the case, Simchi-Levi says. It is crucial because most companies, including Ford, allocate almost all their supplier risk reduction efforts on suppliers with which they spend a lot of money. These smaller but it turns out big risk suppliers simply were flying under the radar - yet this is where the attention really needed to be, in terms of more precisely quantifying TTR and development of mitigation strategies to reduce that TTR and/or raise TTS. The big dollar risks often lie here, hidden from view.
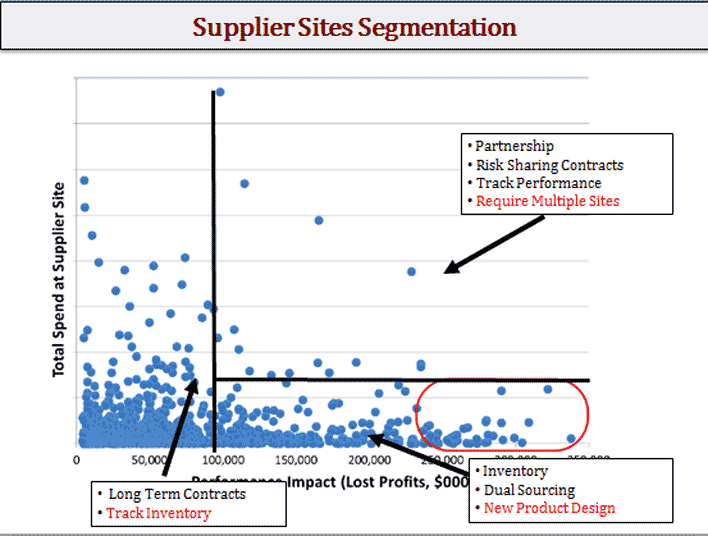
This analysis in turn led a supply chain segmentation strategy, not from a channel/customer perspective as is often the case but from a supplier perspective, again as shown in the graphic below.

Source: David Simchi-Levi
Each cluster is handled a differently from a risk mitigation perspective Noteworthy in the lower right section is the use of product design techniques. How does that come in? By putting more effort to use identical components across makes and models, which might increase the volume of purchases for a part enough that these suppliers could create a second production site. This is in fact exactly what Toyota did after its tsunami disaster.
At Ford, another interesting result was that this analysis uncovered that in some cases the time-to-survive for certain supplier sites was many months, sometimes almost a year. Simchi-Levi says this created for Ford the opportunity to work with some of these suppliers to reduce inventory levels and share in the resulting supply chain savings.
There is a lot more, but I think that's enough for this space. Again, recommend viewing the full vidoecast.
This REI is true supply chain innovation that may lead to a much more systematic approach to supply chain risk management than we have seen to date. Glad we could bring it to you.
What do you think of the enhanced Risk Exposure Index? What questions do you have? Let us know your thoughts at the Feedback button or section below.
|