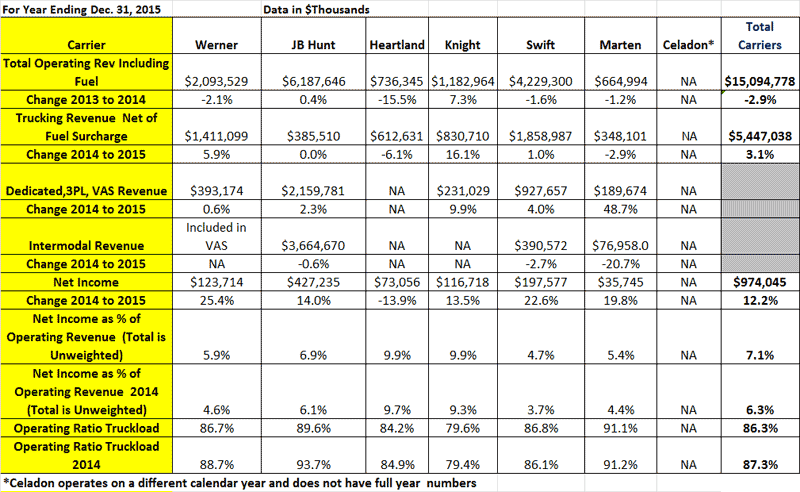
Full year results were actually stronger, stemming from the more favorable market earlier in the year, with net income for the group up a healthy 12.2%, and profits representing 7.1% of total revenues.
Truckload Carrier Results Full Year 2015

As usual, we end with some selected comments from each carrier's earnings reports, starting with Werner, which as is generally the case provided by far the most extensive commentary (though much repeats each quarter in areas like the driver shortage).
Werner
Company reported revenues and record earnings for the fourth quarter and year ended December 31, 2015, and noted that "2015 was a strong earnings year for Werner Enterprises."
Werner noted that "2014 and 2015 were cyclically contrasting years. 2014 provided the benefits of gradually improving demand from a strengthening economy and constrained supply due to a tight driver market and increasing safety regulations. Freight demand in 2015 did not strengthen as the year progressed, as the rate of economic growth slowed. The truckload sector also experienced supply increases in 2015 as small carrier confidence rose as a result of better rates in 2014 and much lower fuel prices beginning in late 2014."
Average revenues per total mile, net of fuel surcharge - a proxy for rates - increased just 0.5% in fourth quarter 2015 compared to fourth quarter 2014.
As has noted in recent quarters, Werner said that "We are continuing to work with our customers to recoup the cost increases associated with more expensive equipment, a shrinking supply of qualified drivers and an increasingly challenging regulatory environment. Strategic customers understand the collective capacity and service challenges facing our company and our industry and are supportive of Werner's ongoing initiatives to provide sustainable transportation solutions in support of their supply chain needs" - read "allow us to raise rates."
Company ended fourth quarter 2015 with 7,450 trucks in the Truckload segment, a year-over-year improvement of 400 trucks compared to the end of fourth quarter 2014.
JB Hunt
In its truckload segment, excluding fuel surcharges increased 12% primarily from increased truck count and core customer rate increases of approximately 3.7% compared to fourth quarter 2014. At the end of the period, JBT operated 2,149 tractors compared to 1,886 a year ago.
Truckload operations, however, account for only 6% of Hunt revenues, and 5% of profits.
Total Hunt intermodal volumes grew 6% over the same period in 2014. Intermodal revenue per load excluding fuel surcharges increased approximately 5% compared to a year ago in Q4.
Heartland Express
Operating revenues decreased 6.2% excluding the impact of fuel surcharge revenues, which the company blamed on "lower load volumes, which were generally due to lower overall industry volumes."
Noted that in 2015 it "significantly increased driver pay."
The average age of the Company's tractor fleet was just 1.25 years as of December 31, 2015 compared to 2.0 years at December 31, 2014.
Knight
Company noted that "During the fourth quarter we experienced a less robust freight environment when compared to the same quarter last year. The contracted portion of our freight volume remained relatively stable, however, non-contract opportunities were challenged by falling load counts and additional competition. This led to a decline in consolidated revenue, excluding trucking fuel surcharge, of 2.8%."
Knight added that "Attracting and retaining high quality driving associates remains a significant industry challenge. Although the current shortage of qualified driving associates has been, and will continue to be, a headwind for adding additional capacity, we have experienced a reduction in our open tractor count."
It added that it increased driver pay in Q4 "in selective geographies."
Swift Transportation
Net income was up 24% in Q4 and 22% for the full year.
Truckload revenue per mile up a modest 1.9%, but the same measure was up a strong 5.1% Swift's dedicated business.
Dedicated revenue net of fuel surcharge grew a strong 11.6% in Q4.
Truck count in the truckload segment increase just a bit, to10,465 from 10,333 in 2014,but overall average operational truck count increased 490 trucks, or 2.8%, year over year in the fourth quarter.
Marten
Operating revenue, net of fuel surcharges, improved 6.6% to $154.0 million for the fourth quarter of 2015 from $144.6 million for the fourth quarter of 2014, and improved 8.2% to $592.6 million for 2015 from $547.7 million for 2014.
Company said it has seen "a soft freight market since the second quarter."
Average revenue, net of fuel surcharges, per tractor per week fell from $3698 in 2014 to $3400.
The company ended Q4 with 2,740 total tractors in its fleet, up from 2,420 at the end of 2014.
Celadon
Company saw its average seated tractor count of 1,693 or 46.8%, to 5,314 in the December 2015 quarter compared with 3,621 in the December 2014 quarter, but that was primarily the result of acquisition, not organic fleet expansion.
Average revenue per tractor per week decreased $374, or 11.9%, to $2,775 in the December 2015 quarter, from $3,149 in the December 2014 quarter, "a result of a lackluster freight environment coupled with the significant growth in our seated tractor count."
However, average revenue per loaded mile was up 6.6% in Q4, to $1.917 per mile in the December 2015 quarter from $1.798 in 2014 quarter.
Any reaction to our Q4 2015 truckload segment review? Let us know your thoughts at the Feedback button (for email) or section (for web form) below.

|