| |
|
| |
|
 |
Supply
Chain by the Numbers |
| |
|
| |
- July 20, 2017 -
|
| |
|
| |
|
| |
|
| |
Is the USPS Giving Big Subsidy to Its Parcel Shipping Side? BP Says Energy Consumption versus GDP Growth Falling Sharply; Google Glasses Making a Comeback? States with the Worst Logistics Infrastructure |
| |
|
| |
| |
| |
$1.46 |
 |
That is the effective subsidy that the US Post Office is giving per parcel in its package service from the traditional mail service, allowing it to lower prices to Amazon and perhaps other large shippers, according to recent analysis by Citigroup and summarized in a Wall Street Journal guest column by Josh Sandbulte of investment firm Greenhaven Associates. It's complicated, but in great summary, as the USPS turned its attention to its package services in the early 2000s with declining mail volumes, Congress passed a law saying the Post Office could not set parcel shipping prices below its costs, after compaints from UPS and FedEx. But how do you calculate the costs, especially in terms of overhead allocation? About a decade ago, another rule was approved that said the USPS must allocate at least 5.5% of its overhead costs to the parcel business. But today, package revenues are 25% of USPS' business - while the overhead allocation has stayed low. The net subsidy, Citigroup estimates, is $1.46 per package. That in turn allows the USPS to offer lower prices to Amazon and other big shippers without running afoul of the law to not price below its costs.
That may be why some two-thirds of Amazon deliveries are made by the USPS, with UPS and FedEx enjoying much smaller shares of the business. That was news to us.
|

|
|
| |
| |
|
|
|
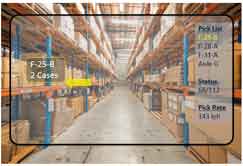
That's how many US workers will be operating with so-called smart glasses by 2025, according to a recent prediction by the analysts at Forrester. We bring that up with the news last week that Google is re-launching s smart glass product, but this time with a business market focus - much of it in the supply chain. The first launch of Google Glass was more consumer oriented - and failed to gain traction, with Google not long afterward pulling the product from the market, seemingly permanently. But now the news that Google Glass is back, no called Glass Enterprise Edition. A big focus will be on so-called augmented or assistant reality application, where the Glasses provide information to workers - such as "lighting up" a pick location as a worker approaches it to improve productivity, or providing instructions to workers on a manufacturing line, as is happening right now at a factory of AGCO, an agricultural equipment manufacturer in Minnesota. Google is said to be very much behind the product, and it claims to have made many enhancements that will make it attractive for these business applications.
|
| |
| |
|
| |
| |
95 |
|
That is how many points for logistics infrastructure - roads, bridges, ports, airports, rail systems and utilities - that the state of Rhode Island received out of a possible 400, based on the annual CNBC study of the best states to do business in. That left the Ocean state tagged as having the worst infrastructure in the US. In fact, the bottom ten were primarily from states in the Northeast. The list of shame: Massachusetts and Mississippi tied for 10th worst, then Maryland, West Virginia, New York, New Jersey, Connecticut. Maine, and New Hampshire, again with Rhode Island ranked dead last.
|
| |
| |
|
|
|
| |
|
 |
| |
|
|
| |