| |
|
| |
|
 |
Supply
Chain by the Numbers |
| |
|
| |
- January 19, 2017 -
|
| |
|
| |
|
| |
|
| |
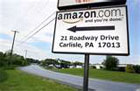
The Amazon Fulfillment Centers Keep Coming and Coming; New DOT Report Finds $37 Billion Annual Infrastructure Spending Shortfall; CSX Better Start Learning How to Run a Better Railroad; NJ Trucking Firm Owner in Jail over E-Z Pass Fraud |
| |
|
| |
| |
| |
26 |
|
|
|
| |
| |
|
$1 Million+
|
|
That's how much in unpaid state tolls New Jersey trucking company EAB Transport/Do it Right Trucking has racked up over the past 13 months, as owner Lester Morales was arrested this week for "theft of services" – just before he was about to board a plane to Aruba! He is being held without bail. Somehow, the company used a delinquent E-Z Pass account for the firms 100 trucks, which went through automated tool booths more than 100 times per day on average. It all adds up very quickly, it appears. "Repeat offenders are committing serious fraud and pose an additional burden on taxpayers and the motorists who do pay their fair share of the costs to maintain and patrol the state's highways and bridges," Middlesex County Prosecutor Andrew Carey said in a statement. That you would almost certainly get caught in such a scheme seems not to have ocurred to Morales.
|
| |
| |
|
| |
| |
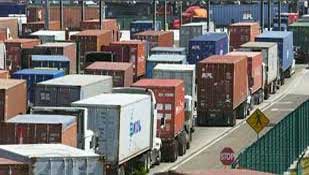
$142.5 Billion |
|
That is how much US governments at all levels need to spend to maintain US transportation infrastructure, well above the $105 billion that was spent in 2012 – the last year for which data was available for the latest bi-annual "Status of the Nation's Highways, Bridges and Transit: Conditions and Performance," from the US Dept. of Transportation. So, as most understand, there is a significant shortfall, though the report notes its analysis does not include any impact from the two most recent so-called highway bills, which included modest additional funding. The report found that from 2002-2012 total US spending on transportation infrastructure increased when adjusted for inflation about 2.6% annually. We looked long and hard in the report to find how that rate of spend increase compared to changes in total vehicle miles travelled or freight moved on US roads and highways, but just couldn't find that data. In better news, the percentage of structurally deficient bridges in the US decreased from 14.2% in the report two years ago to 11%, while the "travel time index," defined as the ratio of travel time in urban required to make a trip during the congested peak period to travel time for the same trip during the off-peak period in non-congested conditions, rose back to 1.26 in 2012 after dipping a bit during the Great Recession - so 26% more travel time when congested on average. We think its much worse than that in many places. |
| |
| |
|
|
|
| |
|
 |
| |
|
|
| |

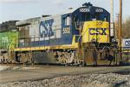 That's how much soon departing Canadian Pacific Railway CEO Hunter Harrison has raised in a fund described as being amassed for a single investment. The fund was created in partnership with activist investor Paul Hilal, and many believe the money is being raised for a takeover bid for rail carrier CSX Corp., which Harrison apparently believes could be run much more efficiently. Under Harrison, CP tried to acquire both CSX and Norfolk Southern, but was repeatedly rebuffed. Since Harrison joined CP, the railroad's operating ratio, a measure of operating costs as a percentage of revenue, fell to a very low 58.6% in its most recent fiscal year, from a very high 81.3% at the end of 2011before Harrison tool the top spot, right. CSX's operating ratio in 2016 was 69.4%, and it has said it is targeting a ratio in the mid-60s longer-term. CSX's stock price is up almost 25% since the news was reported.