|
|
 |
Focus: Sourcing/Procurement
Feature Article from Our Sourcing and Procurement Subject Area - See All |
|
From SCDigest's On-Target e-Magazine
- July 15, 2014 -
Supply Chain News: Commodity and Input Costs Up Modestly in First Half
Most of Gains were in the First Quarter, as Commodity Prices Ended Two-Year Slide
SDigest Editorial Staff
After more than two years of generally falling commodity and input costs, prices were back on the rise in the first half of 2014, though most of the gains in prices came in the first quarter.
Once again, SCDigest has compiled changes in select commodities for the 1H of 2014, using the daily Wall Street Journal cash price listings.
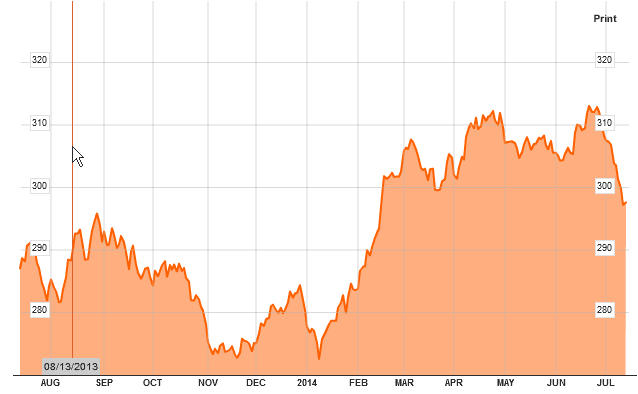
First, however, the chart below shows trends in the past year for commodity overall, based on the Thomson Reuters/CoreCommodity CRB Commodity Index.
As can be seen, the index (which represents a basket of almost two dozen commodities) jumped about 7% starting in January through March, but has since largely bounced around since then. That gain put the index at its highest point since September 2012, but still some 20% below the recent peak in May 2011. Commodity prices in general have been on the decline ever since that peak, until the reversal at the beginning of this year.
Thomson Reuters/CoreCommodity CRB Commodity Index Past 12 Months

Below, we offer a table highlighting different commodities by category, and the changes in price seen since the beginning of the year through the end of the second quarter, and the change from the end of Q1 to end of Q2.
(Sourcing and Procurement Article Continues Below)
|
|
CATEGORY SPONSOR: SOFTEON |
| |
| |
|
|
|
Changes in 1H and Q2 2014 Commodity Prices
| |
Price End Q2 |
Change from End Q1 |
YTD Change |
| Currency |
|
|
|
| US Dollar versus Euro |
0.73 |
0.0% |
0.0% |
| US Dollar versus Yen |
0.986 |
1.9% |
3.9% |
| US Dollar vs Yuan |
6.2 |
-0.2% |
2.4% |
| Group Unweighted Average Change |
|
0.6% |
2.1% |
| |
|
|
|
| Energy |
|
|
|
| Crude Oil, WTI |
104.66 |
6.7% |
9.4% |
| Crude Oil, Brent |
112.4 |
5.1% |
3.6% |
| Diesel Fuel (on road) |
3.92 |
-1.3% |
0.5% |
| Natural Gas |
4.44 |
0.0% |
6.7% |
| Group Unweighted Average Change |
|
2.6% |
5.1% |
| |
|
|
|
| Metals |
|
|
|
| Industrial Silver (Troy Oz) |
20.82 |
4.9% |
10.7% |
| Industrial Platinum (Troy Oz) |
1486 |
4.4% |
9.6% |
| Copper (lb) |
3.18 |
4.6% |
-7.6% |
| Aluminum (metric ton) |
1850 |
8.3% |
4.5% |
| Iron Ore |
93.8 |
-19.7% |
-30.1% |
| Scrap Steel (gross ton) |
1560 |
0.0% |
0.0% |
| Steel |
664 |
2.9% |
-2.6% |
| Tin (cents/lb) |
1335 |
-4.6% |
-3.8% |
| Zinc (cents/lb) |
107.9 |
10.3% |
4.4% |
| Group Unweighted Average Change |
|
1.2% |
1.9% |
| |
|
|
|
| Agricultural |
|
|
|
| Cotton (per lb) |
0.773 |
-13.1% |
-6.4% |
| Corn (per bushel) |
4.13 |
-14.3% |
2.0% |
| Corn Oil |
40 |
-5.9% |
3.9% |
| Rice, Long Grained |
27.8 |
-2.5% |
0.2% |
| Soybeans No. 1 |
13.93 |
-4.7% |
6.9% |
| Wheat, No. 2 (per bushel) |
5.94 |
-17.6% |
-22.7% |
| Chicken Broilers (per lb) |
1.12 |
3.7% |
19.1% |
| Coffee, Columbian (per lb) |
1.95 |
-3.9% |
54.8% |
| Milk, Non-fat Dry (Chicago lb) |
178 |
-12.3% |
-14.8% |
| Sugar (metric ton) |
380 |
-2.8% |
-3.6% |
| Group Unweighted Average Change |
|
-7.3% |
4.8% |
As can be seen, the US dollar was flat against the Euro year to date, while up almost 4% against the Japanese Yen and 2.4% against the Chinese Yuan. Most in the US would like to see the Yuan gain on the dollar, making Chinese exports more expensive, on the belief the Yuan is undervalued.
Energy prices overall were up 5.1% in the first half, largely split between the first and second quarters. Natural gas prices rose 6.7% in the first half, but are still very cheap compared to prices across most of the globe, and at $4.15 per mmbtu are well below the $7.00 or so seen in 2009, as the fracking revolution rolls on.
Metals prices were up on average 1.9% in the 1H, but as always thee were differences underneath. Industrial silver and platinum were up 10%, while iron ore took a plunge, down 30% in the first half. Copper prices rose in Q1 but then fell sharply in Q2 to end the 1H down 7.6%.
Agricultural commodities were mostly down on Q1 but somewhat reversed direction in Q2, though the average gain for the first half was overly influenced in our average by the 54.8% gain in coffee prices. Wheat prices fell 22.7% in the first half.
Commodities started July most down thus far, and experts are predicting a soft market for the rest of the summer, good news for manufacturers and other buyers. The civil war in Iqaq took oil prices up 5% or so, but that seems well less than other geopolitical tensions have done in the past.
Where do you see input prices headed? Let us know your thoughts at the Feedback section below.
|
|
|
Recent Feedback |
|
No Feedback on this article yet
|
|
| |
| |