From SCDigest's On-Target e-Magazine
- April 2, 2013 -
Supply Chain News: Input and Commodity Costs Mostly Flat in Q1, Lowest Rise Since 2010
Demand is Soft and Supplies Plentiful in Most Categories; US Dollar Strength Also Helps
SDigest Editorial Staff
Even as the US stock market was soaring 10% in the first quarter, commodity and input costs were generally flat, as overall global demand remains soft in most categories and supplies are strong. That represents a change from the past several years, when stock and commodity prices mostly have moved in lock step.
SCDigest Says: |
 |
We will also note that China and Australia announced this week that they would soon begin trading in their own currencies without using the US dollar. |
|
What Do You Say?
|
|
|
|
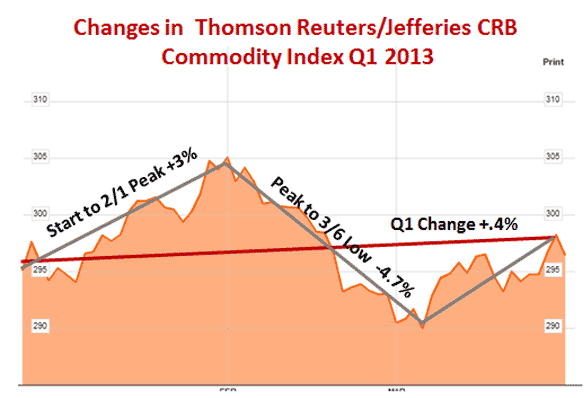
The Thompson Reuters /Jeffries CRB Commodity Price Index ended Q1 basically flat, up just .4%. It reached its highest point in early February, up 3% from the start of the year, and then fell 4.7% from there to reach a low on March 6. But prices recovered from that point to end the quarter about where they started.
That measure was consistent with other commodity indexes, which all use their own mix of energy, metals, agriculture and other goods to measure overall input prices. The Dow Jones-UBS commodity Index, for example, was down 1.1% in the period.
By most measures, this was the weakest pricing environment overall in a first quarter since 2010.
The bottom line is that input costs in general were not a big worry during the fist three months of the year.
That pricing weakness was seen in combination with - a partly because of - a strengthen of the US dollar in the quarter, as the greenback rose 2.6% against the Euro and about the same against the Canadian Lune. Because most international commodity prices are set using the US dollar, a rising dollar will push prices down by an equivalent amount globally for US buyers, all things being equal. The dollar did fall slightly (.3%) against the Chinese Yuan in Q1, continuing a two-year trend.
We will also note that China and Australia announced this week that they would soon begin trading in their own currencies without using the US dollar, with the Chinese converting Aussie dollars to the Yuan, as efforts by some to displace the US dollar as the world's reserve currency continue.
Energy prices were up in the quarter, led by the continuing surge in natural gas prices in the US, which continue to move higher from historic lows seen the last couple of years, up almost 16%. Oil prices were up in the low single digits, and US diesel prices rose 2% in the quarter.

Source: Thomson Reuters Jeffries, Plus SCDigest Analysis
(Sourcing and Procurement Article Continues Below)
|