From SCDigest's On-Target e-Magazine
- Oct. 10, 2012 -
Supply Chain News: Commodities Largely Up in Q3 but Remain Down for Full Year to Date
Conflicting Reports over Changes to Walmart's Relationship to Trading Giant Li & Fung
SDigest Editorial Staff
Commodity prices mostly made a comeback in Q3, led by sharp rises in many agriculture products driven by the drought in the US, but all told prices are mostly down for the full year, as the steady, multi-year rise in input prices has reverse itself since early 2011.
SCDigest Says: |
 |
With the IMF just this weak predicting even further slowing of the global economy and China expected to see its growth fall for the seventh straight quarter in Q3, the pressure on commodity prices is likely to continue to be downward
|
|
What Do You Say?
|
|
|
|
Overall, commodity prices had been on the march higher for nearly a decade.
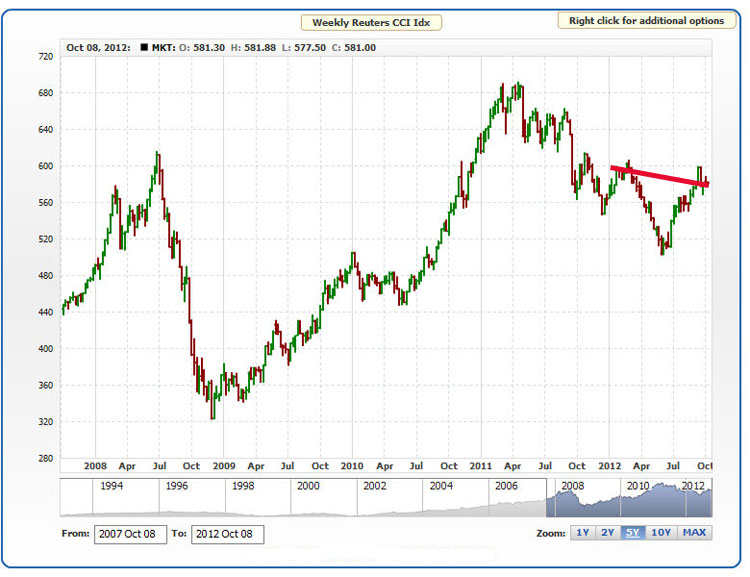
After rising rapidly during the mid-2000s, commodities naturally enough hit the skids in late 2008 and 2009 during the financial crisis, finding a bottom in about November of 2009, according to the often cited Reuters CRB Commodity Index (see graphic below).
But as growth in China quickly returned, the commodities index headed up again, moving higher in a nearly straight line except for a few months in early 2010, peaking in about April of 2011.
From there it has been mostly down, providing some measure of relief to input costs for most companies, as a combination of slowing growth in China as well as India and Brazi and continued financial troubles in the Euro zone, have reduced global demand and set many prices tumbling. A strong US dollar, which is used to price most commodities globally, has also kept a lid on costs from a US perspective.
The Reuters CRB index has fallen about 18% from its peak in 2011 through early this week.
But as the chart shows, commodities made a bit of a rally in Q2 after bottoming in May.
To look at individual commodities, we used data from the World Bank, which tracks average prices in a wide number of commodity categories. In most cases these are global prices, which could be different than the pricing dynamics specific to the United States, but in most cases they reflect the same general direction as changes in the US.
In some cases, such as natural gas, where there is a huge delta between the US and global price, the World Bank does separately list a global and regional price.
Reuters CRB Commodity Index over Past Five Years
(Sourcing and Procurement Article Continues Below) |

