Larkin Says: |
 |
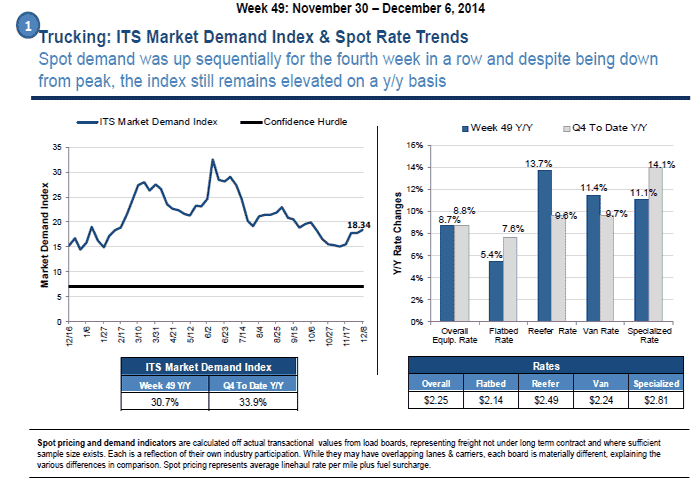
| Dry van rates on DAT increased 2.4% sequentially and are up 8.2% y/y, while on ITS rates are down 6.7% sequentially, but up 11.4% y/y. |
|
What Do You Say?
|
|
|
|
New Expert Insight Column on SCDigest: We have partnered with Stifel Financial Corp. to publish its weekly recap of the week in transportation, written by well-known analyst John Larkin. Check the SCDigest home page each Monday morning for the latest edition.
Key Insights From This Week's Fundamental Research
The price of oil continues to decline as both supply increases and demand projections adjust downward. It is no
secret that the United States continues to emerge as a leader in petrochemical production, placing a heavy (invisible)
hand on the supply side of the oil pricing equation. Equally important, but less commonly discussed, is how demand plays
into that equation. This past week the International Energy Agency announced a downward revision on the outlook for
global oil demand growth in 2015 by 0.23 million barrels per day (mb/d) to 0.9 (mb/d), a 20% reduction in expected
growth.
A strong dollar and the lifting of subsidies are noted as two factors behind the change in expected world oil
demand in 2015, which is now seen reaching 93.3 mb/d next year, from 92.4 mb/d in 2014. This matched with weak data
out of China has overshadowed strong consumer sentiment in the U.S. By Friday's close the Dow Jones Industrial and
Transportation averages had fallen 3.8% and 3.4%, respectively while the CBOE Volatility Index, alternatively called The Street's "fear factor," had risen 78.3% from 11.8 to 21.1 since the beginning of the week. See our note How Will Falling Oil
Prices Impact Transportation & Logistics Companies? for our thoughts on the impact to Transportation & Logistics.
Investment Conclusions: News from this past week does not change our current investment thesis on any
sector, but we continue to watch the supply & demand dynamics behind the petrochemical industry as the direct
impact of fuel prices and the raw transportation tonnage demand for both crude and the industrial products that
require it as an input for production are interrelated to profitability across our sectors. We currently expect
domestic crude oil production at established operations to continue, protecting near-term rail volume, and it is
likely only the further investment that remains at risk.
We remain Buy-rated on railcar manufacturer, lessor and
diversified manufacturer Trinity Industries (TRN; $26.99) while reducing our target price from $45 to $41 (or from
11.0x to 10.0x our 2016 EPS estimate of $4.05) to reflect the view that lower energy prices have a net negative
impact on the majority of the company's business segments. For the truckload sector, we remain positive on
industry fundamentals, and think a low-cost fuel environment could be another positive tailwind for Buy-rated
truckload carriers, Swift Transportation (SWFT; $28.15), Celadon Group (CGI; $21.16), and Universal Truckload
Services (UACL; $28.45). Prices are as of the close, 12/12/14.
Previous Columns by
John Larkin |
|
|
Key Insights From the Analysis of Industry Data Feeds
Trucking:
• Spot demand was up on a sequential basis in week 49. The ITS Market Demand Index (MDI) measured 18.34 in W49
(+2.75% sequentially). Load-to-truck ratios on DAT were also up. Dry van, refrigerated, and flatbed load-to-truck were up sequentially 2.3%, 8.6%, and 8.9%, respectively.
• Spot rates were mixed in W49 with DAT pricing showing continued recovery from November, while ITS' rates have
mostly declined sequentially. Dry van rates on DAT increased 2.4% sequentially and are up 8.2% y/y, while on ITS
rates are down 6.7% sequentially, but up 11.4% y/y. The refrigerated segment shares the same story with sequential
rates up 1.7% on DAT but down 6.4% on ITS, though both are up 14.8% y/y and 13.7% y/y, respectively.
• Spot demand continued recent trends this week relative to 2013 levels, maintaining a consistent y/y spread as we move into the holiday season. We don't expect demand will drop below 2013 levels, though networks still lack
proper balance. However balance has begun to normalize and UPS has indicated it will not be caught without
sufficient capacity this year - no matter what.

Rail
• Class I commodity carloads were up 10.9% y/y during W49. Despite recent volatile news around oil railroad demand
has continued to hold strong. Trailing four week y/y carload figures are up 4.2% across all rails, with the CN
performing the strongest (6% y/y carload growth) and NSC the laggard of the group (0.9% y/y carload growth).
Quarter to date y/y commodity carload volume is up 4.7%, again with CN and NSC the leader and laggard of the
group (+8.2% and -0.9% y/y carload volumes).
• Intermodal volume was up 11.4% y/y on the week. UP's volume was up a whopping 17.6% y/y on the week. UP is
down sequentially from 3Q to 4Q by 0.5%, as we expect seasonally, but is up 6% y/y QTD. Trailing four week y/y
figures show intermodal carload growth of 2.3% with KSU and CP the leader and laggard of the group (+10.3% and
-6.9% y/y, respectively).
• Total unit volume (i.e. commodity carloads & intermodal units) showed a sequential incline, up 11.1% from W48 and
up 7.0% y/y. KSU and CP the leader and laggard of the group (+7.0% and -1.6% y/y, respectively).
• Class I performance metrics still remain at depressed levels. High carload demand, matched with infrastructure
challenges have made a correction near impossible. For the 4Q14-to-date, velocity is down 5.0% y/y. Terminal dwell
is up 9.1%, and it appears that this congestion has spread east as CSX and NSC are both struggling to deal with
strong volume surges in the back half of the year. Cars on line are up 14.0% QTD y/y, with BNSF the largest
contributor.
Any reaction to this week's note? Let us kow your thoughts in the Feedback area alone. |