Walmart is just out with its Global Responsibility Report for 2015 - and quite a document it is: 137 pages that ups the ante in terms of Walmart's mission to make the world a better place (see Walmart is on a Sustainability Mission).
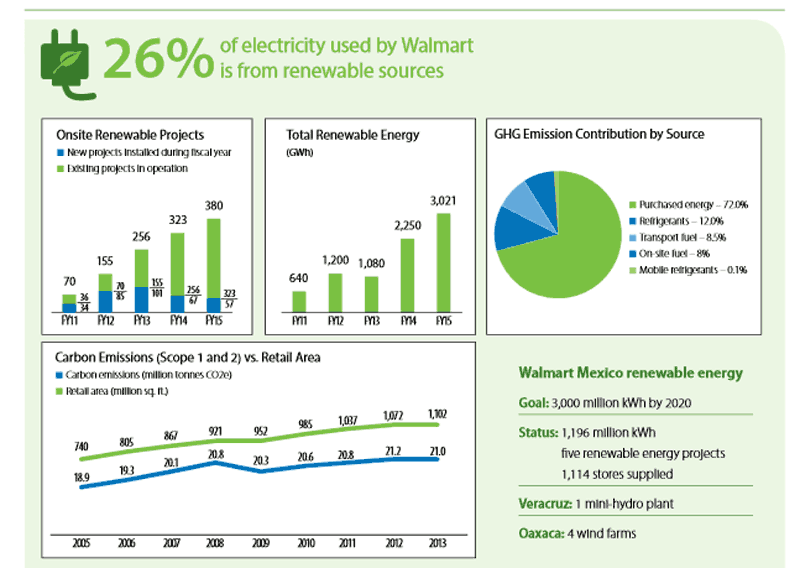
Walmart altered the graphics a bit from previous years, dropping some ones we have featured in the past, such as one showing the results of Walmart's vendor audits and related compliance, and others showing more specifics on what is happening in Walmart transportation. So this year we decided to take a look at an interesting chart on Walmart's use of energy, which you will find below.
Walmart and Renewable Energy + CO2 Emissions

Some interesting data from this chart:
• Walmart's CO2 emissions really are tracking pretty closely to its changes in retail store square footage, with the exception of a significant drop in relative CO2 from 2008 to 2009.
• The vast preponderance of Walmart's CO2 emissions (72%) come from purchased electricity, about which it in practice it has very little control.
• The one lever it does have in this regard is building its own renewable, low carbon energy sources, which Walmart is clearly is doing, with what looks like strong growth in renewable energy production in the past two years, and a number of other rewable projects in progress.
• Transportation only accounts for 8.5% of total carbon emissions.
And now you know.
Any Feedback on our Supply Chain Graphic of the Week? Let us know your thoughts at the Feedback section below.
|