This Week on SCDigest:
US Logistics Infrastructure - Critical Issue or Not?
Supply Chain Graphic of the Week and Supply Chain by the Numbers
This Week's Cartoon Caption Contest Winner Announced!
SCDigest On-Target e-Magazine
Expert Contributor: Voice Technology Must Be Operations-Tested, IT-Approved
This Week on "Distribution Digest"
Trivia  Feedback

Become a Sponsor
Subscribe
SCDigest Home Page  
  Newsletter Archives September 9, 2010 - Supply Chain Digest Newsletter

Featured Sponsor: ARIBA


New! Industry Research Study -- Gartner Report:

Significant Benefits Realized With Supply Chain Management in the Cloud!


WEDNESDAY'S VIDEOCAST

Videocast Series: Building Smarter Consumer Product Company Supply Chains

Part II: Capitalizing on Supply Chain Complexity and Your ERP Investment in the Consumer Products industry


Featuring Remzi Ural and

Michael Watson of IBM


Register Now!

UPCOMING VIDEOCAST

Videocast Series: Retail Supply Chain Best Practices

Part 3: The State of Advance Ship Notices in the Consumer Goods to Retail Supply Chain


Featuring Dr. Brian Gibson and Dr. Brent Williams
of Auburn University


Register Now!


UPCOMING VIDEOCAST
Videocast Series: Achieving Real Results with Supply Chain Software

Part 1: How Cummins Filtration Leveraged WMS and Other Distribution Technology to Meet Operational Goals


Featuring Melissa Schmidt
of Cummins Filtration


Register Now!

NEW! UPCOMING VIDEOCAST

Videocast: Taking Control of Inbound Freight Successfully

From Routing Guides to Advanced Inbound Transportation and PO Management

Featuring A Case Study and

Jim Barnes and Stephen Craig of EnVista


Register Now!

NEW! ON DEMAND VIDEOCAST
Videocast: Achieving Real-Time Inventory Visibility + Optimizing Lift Truck Performance in the DC


Register

NEWS BITES

This Week's Supply Chain News Bites
  - Only from SCDigest


Supply Chain Graphic of the Week: Container Volume Share by Major Trade Lanes


This Week’s Supply Chain by the Numbers for September 9, 2010:

Ford Forgets Move Back to US; Siemens says It will be The Green Supply Chain Leader; India Logistics Inefficiency Costs it Big Time; P&G Invests in Huge China DC


CARTOON CAPTION

CONTEST WINNERS!


Aug. 23, 2010 Contest

See this Week's Winners and

other Great Entries

New Cartoon on Monday

NEW! INDUSTRY RESEARCH STUDY

FROM ARIBA


ON TARGET e-MAGAZINE
Each Week:

RFID/AIDC
Transportation
Procurement/Sourcing
Manufacturing
Global Supply Chain
Trends and Issues

Distribution/Material Handling

Weekly On-Target Newsletter
September 8, 2010 Edition

Last Chance Cartoon, Cloud WMS, ATA Loses in LA, Procurement Skills, and More

 
NEW! EXPERT CONTRIBUTOR

by Scott J. Yetter,

President

Voxware, Inc.

Voice Technology Must Be Operations-Tested, IT-Approved


THIS WEEK ON DISTRIBUTION DIGEST


HolsteHolste's Blog: With The Economy Poised For A Gradual Comeback, Distributors Look To Automation To Maintain A Lean Operation

Top Story: You May Need a New WMS If..
Top Story: Material Handling Industry of America Ends Run of One Trade Event, Announces New MODEX Show in Atlanta
Vendor News: New Bar Code Scanner Provides Visual Confirmation of Successful Scans


Visit Distribution Digest


SUPPLY CHAIN TRIVIA
   

Q.

What were the top 5 countries overall in the 2010 World Bank Logistics Performance Index?

   
A.
Click to find the answer below
   

US Logistics Infrastructure - Critical Issue or Not?

I am often torn (as I suspect many of our readers are as well) when pondering the state of US logistics infrastructure.


On Monday, president Obama called for investment of an additional $50 billion on top of existing budgets to improve infrastructure in three areas (roads, runways, and rail lines), and creation of a "Infrastructure Bank" that will keep more permanent focus on this issue and in theory a more steady stream of funding for years to come.

So the questions are, it seems to me:

  • What is the true state of US logistics infrastructure now, really?
  • How can you most rationally separate "consumer" versus business issues?
  • How big a factor is infrastructure in a country's global competitiveness?
  • How should any additional investments dollars best be spent?
Gilmore Says:
 

"Being "competitive" as a country, and the role of logistics infrastructure in that equation, is not about being better at getting Chinese made goods to US retail shelves faster."

What do you say?

 
Send us
your Feedback here
 

I am going to start with question #2 first, actually, because there is no question that from a non-business perspective, congestion and safety are clear and rising issues. Traffic congestion is most major US metropolitan areas is miserable, adding in effect many minutes or even hours to the work day for millions in addition to the aggravation. The aging bridge system - soon forgotten, it seems, after the bridge collapse in St. Paul in 2007 - probably represents real danger to drivers, and that danger increases each year as repairs are bypassed.  Lack of investment in airport runways means that the slightest hiccup in the weather brings painful delays throughout the US air systems, as many of us experience regularly.

While there is some overlap with business logistics concerns in these areas, primarily in the congestion in cities that can certainly delay local deliveries but also truck traffic passing through those areas, it still seems to me that we need to sort of compartmentalize potential investments into those that are primarily consumer oriented, primarily business oriented (e.g., ports) or both.

In terms of the state of US infrastructure, I think in reality there are mixed signals.

The latest "report card" on US infrastructure from American Society of Civil Engineers in 2009 gave the country a grade of D, and called for investment of some $2.2 trillion over five years  to address the issues. With planned spending of roughly $1 trillion in that period, that leaves a shortfall, the ASCE says, of $1.17 trillion (that's with a T). (View ASCE chart - you may have to expand magnification).

A few points: (1) you could say the ASCE has a strong vested interest in greatly increasing infrastructure investment; (2) the numbers include many infrastructure categories, including parks and levees, though it identifies a shortfall of $550 billion in roads and bridges, by far the largest gap; and (3) as per my question #4, since under the best of circumstances nothing like an extra trillion dollars is going to be available, what areas are really most critical (remembering to consider consumer versus business logistics focus)?

I went around on this last year a bit too, and frankly could hardly find anyone who could intelligently comment on that specific question. If you can, I would love to hear from you.

In 2006, then UPS CEO Mike Eskew gave a speech on the US logistics infrastructure deficiencies that drew a lot of attention. Eskew commented that "What's shocking, quite frankly, is the inability of our transportation infrastructure to keep up with the normal day-to-day stresses imposed upon it," said UPS CEO Mike Eskew. "Our highways, waterways, railroads and aviation networks are simply not keeping up with ordinary demands."

In 2009, with Eskew now retired, I inquired into UPS as to what areas, specifically, limited additional investment dollars should go. I ultimately talked to UPS spokesman Malcom Berkley, a good guy and straight shooter, who didn't want to offer much in the way of specifics about how to most effectively allocate scarce dollars, other than to say attention should focus on "bottleneck points."

What he did say , however, was that the silo-oriented approach in Congress needed to change.

"We don't want there to be a highway fund, and a rail fund, and an airport fund," Berkley told me. "We need a single, integrated approach to the infrastructure problems."

Which, one could easily argue, an "Infrastructure Bank" could provide if it was well structured and was run effectively - as always in Washington, large hurdles.

The funny reality though is that in talking to many supply chain executives, I find very few to the point of none really talking about infrastructure as a concern, short term or long term. The one exception - the 2005-06 port delays, especially in Long Beach/LA. But there it was very focused on improving container unloading capacity and speed; Asian ports last I looked were still significantly more productive than the best the US has to offer, as many noted at the time. But a combination of multi-port strategies by many importers, some efficiency gains at US ports and programs like PierPass that better distributed container volumes in LA/Long Beach across the full day, and of course more lately the recession and steep drops in container volumes means - at least for the present - port throughput is at best a modest concern for most shippers.


Despite perceived infrastructure weaknesses, general improvements in transportation effectiveness overall have enabled many companies to build fewer, larger DC further away from customers and still meet delivery requirements. Rail carriers in general continue to make improvements in speed and consistency, largely through software improvements  and centralized network control.


In its second global Logistics Performance Index last year, the World Bank rated the US as having the seventh most efficient logistics infrastructure, behind (in order) Germany, Netherlands, Norway, Singapore, Japan and Switzerland (all much smaller land masses than the US). To add more perspective, top-ranked Germany had a score of 4.34 out of 5, versus a 4.15 mark for the US. (See
World Bank Releases Latest Ranking of Logistics Performance by Country.)

So who is right? The Society of Civil Engineers, or the World Bank analysts? Is the problem not the present, but the future?

We can all agree a lousy infrastructure or related barriers to logistics efficiency can cost a country dearly in dollars and competitiveness - witness Mexico and India as two big time examples.

Certainly port congestion and uncertainty in the US did and could again impose real costs on companies and force them to bulk up on inventory. And twice over the last few years, we've seen US exports hurt by trouble getting containers or outbound shipment berths - though these were not really "infrastructure" issues.

And it seems to me how much you might be tempted to spend to improve the business logistics infrastructure here is directly related to how manufacturing will ultimately fare in the US. The idea of being "competitive" as a country, and the role of logistics infrastructure in that equation, is not about being better at getting Chinese made goods to US retail shelves faster, but about lower costs for US manufacturers so that they can better compete here and overseas against global competition. Add to that this question: how much would improved infrastructure here change the overall offshoring dynamic?

Unfortunately not much, I think, though nascent signs of some return on production to US territory are encouraging.


Lastly, I will again note as I did last year that it is most likely that rises in diesel taxes will be the key source for any significant increase in business logistics infrastructure spend. At some point, clearly the cost of that increase starts to outweigh the business benefits. Everyone wants improved infrastructure if someone else pays for it, but if shippers must foot the bill, how far would they really go? I also wonder if logistics professionals in major cities wouldn't really opt for less congestion on the way to work than for really improving rail coverage across the US, if they had the choice.


More questions than answers here I realize, but I am just trying to frame the questions and debate logically. Would love your thoughts on this.


What grade would you give the US logistics infrastructure today, and why? Should we be very concerned about the future, given current trends and dynamics? Do you like how we have framed the issues - or is Gilmore all wet? Let us know your thoughts at the Feedback button below.


Send an Email


Web Page/Printable Version of Column


SCDIGEST RSS FEEDS


Do you use an RSS reader? Do you have a MyYahoo! or personalized Google page?

For these and more you can have SCDigest delivered right to your personal pages, all week long.

You can subscribe to our RSS feeds in two ways:

  1. Copy our RSS link into your RSS reader - it's easy! www.scdigest.com/rssfeeds.xml

  2. Click on a button below to quickly add it to your favorite readers.
 
YOUR FEEDBACK

We received quite a few letters on our First Thoughts piece on "The Probability of Supply Chain ROI," which described a much different approach, using probability analysis, for estimating the financial attractiveness of supply chain projects.

But we only publish one this week, because it involves an interesting exchange between Richard Cushing, a business executive and blogger, and SCDigest Editor Dan Gilmore. We publish it in its entirety below - and we think you will enjoy it.


Feedback of the Week - On the Probability of Supply Chain ROI:

I wrote a response to your article on ROI “probabilities” and you’ll find it below.


I’d appreciate hearing your commentary on it.  Thanks.


Richard D. Cushing

Dan Gilmore wrote in “The ‘Probability’ of Supply Chain ROI” propounds properly and rationally the fact that any “forecast,” including forecasts of ROI (return on investment) should not be a single number. Rather, as anyone properly trained in statistical methods will tell you, it should be a range of numbers. The range of numbers would generally be calculated based on a single calculated value plus and minus values that represent the confidence intervals or, simply put, how likely the statistician believes his estimates the calculates will approximate reality. A larger range indicates lower levels of confidence and a smaller range higher confidence levels.

Now, while Gilmore is mathematically correct, the fact remains that most small-to-mid-sized businesses (SMBs) simply do not have anyone trained in statistics on their payroll and they are not likely to go out and hire a statistician to produce ROI forecasts for their IT projects – since this would, by definition, automatically reduce the ROI of the enterprise as a whole in the short term.

Back on a growth trajectory

Gilmore makes another comment in his article with which I wholeheartedly agree: “[T]here is some evidence that companies are in fact looking at investments that can help them to get back on a growth trajectory (read: increasing Throughput) without having to add much in the way of head count (read: Operating Expenses) by achieving productivity gains.” Given the world-wide economic malaise that is showing some signs of lessening (for the moment, at least), Gilmore’s description probably suits the vast majority of SMBs across the U.S. and beyond.

Furthermore, many others besides me have written that a firm stand on return on investment will be the hallmark of technology spending in the 2010 and beyond. So, I can hardly fault Gilmore for suggesting that SMB executives and managers need to become increasingly sensitive to and realistic about ROI for every kind of investment in their firms’ futures.

Too much complexity already

Despite my agreement with Gilmore on theoretical grounds regarding forecasts – including ROI forecasts; and despite my agreement with him regarding the goal of companies to get back on a growth trajectory through wise investment of capital resources, I must disagree with him on the matter of adding useless complexity to the return on investment forecasting process.

Allow me to explain why I use the harsh term “useless” to describe such an effort in the development of a ROI forecast for an IT project.

First  of all, let me say that statistical methods ought to be applied where they make sense. Statisticians generally agree that a valid statistical sample must contain at least 30 members. This works great where you have 30 dogs, 30 cows, 30 houses, 30 automobile, 30 miles of roadway, and so forth for comparison. Then, of course, you need to factor for environmental differences. Thirty or more cows all in the same pasture, eating the same foods, and enjoying the same climate would make a pretty good statistical sample for some studies of cows. On the other hand, three Holstein cows in northern Minnesota, two long-horns in west Texas, 15 black whiteface cows in eastern South Dakota, and ten mixed-breed cows in central Florida are not likely to constitute a good “sample” for cow studies.

Why?

Simply because there are too many environmental dissimilarities surrounding the cattle. By the time these factors were accounted for, (generally speaking) any results would have such a large confidence interval as to make any prediction almost meaningless.

When considered as a whole, a typical SMB has tens of thousand of variable at work within the enterprise. Any number of those variables are likely to dramatically separate it any “sister” enterprises in a sample group used to forecast ROI outcomes.

Of course, the fact that traditional ERP – Everything Replacement Projects – are going to affect the whole enterprise is a big part of the problem of predicting ROI outcomes. With tens of thousands of variables at play, picking the winning number is far more challenging than winning the lottery.

Reducing the scope reduces the complexity

First of all, a good many SMBs today have a “pretty good” ERP system in place – regardless of its brand. Unless there is some pressing reason to undertake a traditional ERP – Everything Replacement Project, it is probably a far better idea to consider a New ERP – Extended Readiness for Profit project instead.

Narrowing the scope of the project reduces the complexity. And, reducing the complexity increases the likelihood that your ROI forecast will be more on-target. Allow me to give you a couple of examples:

If your executive management team were to elect to pursue either of these projects – or both – the goals are specific and measurable – as would be the expected outcomes. ROI calculations become simple:

TOC ROI

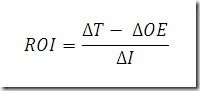
Where T = Throughput (Revenues less Truly Variable Costs), OE = Operating Expenses, and I = Investment.

Simple. Elegant. And ROI calculations are far more likely to be right than any calculation around traditional ERP – Everything Replacement Projects.


Dan Gilmore Responds:

I will just say, having been involved in ROI stuff for years, that:


1. It's not just SMBs that lack the stat resources = big companies too


2. I don't agree very much about adding complexity  - you have to see Doug Hubbard in action. But I do agree it does add some complexity - more mental than actual, if that makes sense. It's just not what anyone is used to.


But, it is fundamentally better. Where I think your disagreement errs is that from a practical perspective, ROIs in practive are all over the place, and rarely hit the projected number. In fact, for ERP, the damn solutions and process are so complex the idea that you calculate a single expected number is almost ludicrous - and no one ever goes back to actually calculate an  real ROI. The only attempt I know was when I was at META Group in 1999, before it was bought by Garnter, which found on average a negative ROI from ERP (but you can bet the ROIs all showed the investment well meeting hurdle rates). 


Doug Hubbard has a way of developing confident intervals that I think offer a more more rational way of dealing with this reality. For example, going back to ERP, what is the likelihood that the expected consulting costs will be 50% greater than what is in our ROI projections? Based on a variety of inputs, honing in on those probabilities is actually not that hard.


Big insurance companies now use this model routinely for large IT investments, because it is the natural way for them to think. Dell did or does do it. Once it is baked into how you do analysis, the perceived complexity goes away, and it is for more revealing about the assumptions that go into the analysis.


I am not a statistician, but I can tell you from being involved in many "one number" analysis, mostly as a software vendor, they are largely baloney.

Cushing Responds:

Well, the simple answer is that making your ROI estimate a range rather than a single number increases the likelihood that you may hit – or at least be nearer – your target.  It, in effect, means that you have simply made the target larger.


Great! But like the archer that has trouble hitting the bulls-eye, simply making the bulls-eye three times larger does not make the archer more accurate. It simply increase the likelihood of his hitting the (now much larger) bulls-eye.


Actually, however, my point is NOT the accuracy of the ROI estimate. Most business executives with whom I have worked would be pleased to have assurance of a positive ROI, even if they did not calculate the number in advance, or if they did and missed the mark by some significant factor.


The problem is that far too many technology projects are undertaken with only the vaguest of notions about and worthless rules-of-thumb ROI calculations from the vendor or VAR.  I’d be happy if more executives and managers took time to actually figure out WHAT NEEDS TO CHANGE, WHAT THE CHANGE SHOULD LOOK LIKE, and HOW TO EFFECT THE CHANGE (specifically, how their technology spend will actually contribute to effecting the necessary change). They need to know how the change will affect THROUGHPUT, OPERATING EXPENSES, and what the INVESTMENT will be to do so.


My only point is that adding complexity to the calculation of ROI – like enlarging the bulls-eye – does not necessarily add value to the ultimate goal and that is, I believe, to assure (inasmuch as possible) a positive ROI for every investment and to help assure that the RIGHT projects are undertaken where differing projects are likely to result in differing ROIs.


As I said, I appreciate the mathematician’s desire to have a range for theoretical reasons, but the theory adds little value where the rubber meets the road, in my opinion.


Thank you for the thought-provoking article and conversation.


SUPPLY CHAIN TRIVIA
Q.

What were the top 5 countries overall in the 2010 World Bank Logistics Performance Index?

A.


(1)
Germany; (2) Singapore; (3) Sweden; (4) Netherlands; (5) Luxemburg; the US was 15th


6