What is the breakdown of total container movements by major shipping lane or theater?
We must confess to not knowing, until we saw this graphic in a recent excellent analysis of the ocean shipping market by container leasing company Sea-Axis. The overall analysis predicts that ocean shipping capacity will soon strongly exceed global demand, driving rates back down through mid-2011 after the recent increases in ocean cargo rates. (See
Despite Growing Recovery In Container Volumes, Ocean Shipping Capacity Still Growing Faster than Demand.)
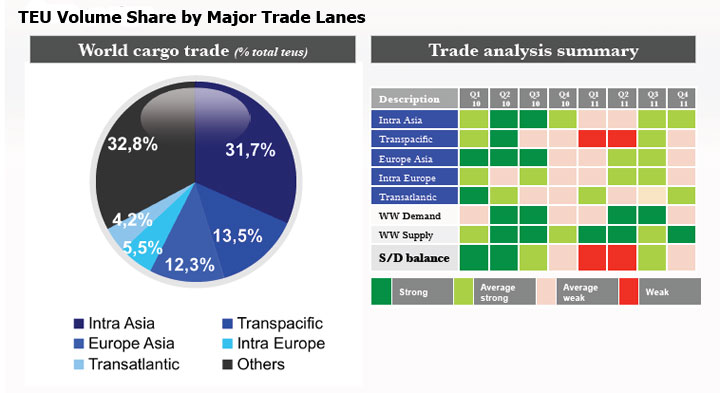
As can be seen from the graphic, intra-Asian movement by far dominates in terms of container traffic in defined lanes (besides the "Other category"), at nearly 32% of the global total. This is a reflection of the combination of the rapid growth in Asian economies and the movement of components to support finished goods production before final shipping to the US and Europe.
Traffic from Asia to the North America comes in second place, but well behind at 13.5%, just ahead of Asia to Europe lanes at 12.3% of the total.
Perhaps suprisingly, Trans-Altantic container volumes in both directions between the US and Europe are in last place, representing just 4.2% of the world total TEU movement.
Source: Sea-Axis, based on Drewry Shipping Consultants Data
The right hand side of the graphic summarizes the supply-demand balance by those same trade lanes. As can be seen, Sea-Axis predicts significant over capacity on a global basis and the Transpafic routesin the first two quarters of 2011.
Agree or
disagree? What is your perspective? Let
us know your thoughts at the Feedback button
below.
|


