SCDigest Editorial Staff
SCDigest Says: |
 Not surprisingly, the data found that Movers were much more likely to employ auto ID technologies (bar codes, RFID) versus the more manual data collection approaches (key entry, paper) of the “Others.” Not surprisingly, the data found that Movers were much more likely to employ auto ID technologies (bar codes, RFID) versus the more manual data collection approaches (key entry, paper) of the “Others.”

Click Here to See Reader Feedback
|
Every few years, the Manufacturing Execution Systems Association (MESA) publishes a report on Metrics that Matter.
The most recent report was recently released by this trade industry group, a follow-up to the last report that was published in 2006. This year, the report was developed by analyst company Cambashi, with help from MESA metrics working group members, based on surveys responses from about 140 manufacturers across a wide variety of industries and manufacturing models (e.g., make-to-stock, make-to-order, etc.).
The report is somewhat sprawling and not always easy to follow, but provides much interesting and useful insight nevertheless.
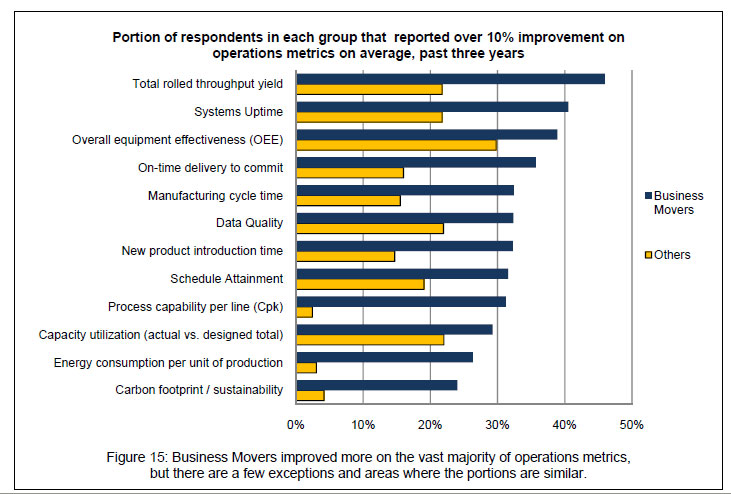
The report notes that it is not always clear whether the individual responses represented performance and practices across an entire enterprise, a specific plant, or somewhere in between. Nevertheless, as in 2006, the report divides respondents into two groups: Business “Movers”, which showed improvement across a number of key operational metrics, and basically everyone else (Others).
The specific criteria for dividing the Movers from the rest is not clear and more disappointingly it is not even noted what percentage of the total fell into each category, but once that division was made, the data showed significant performance advantages for the Movers.
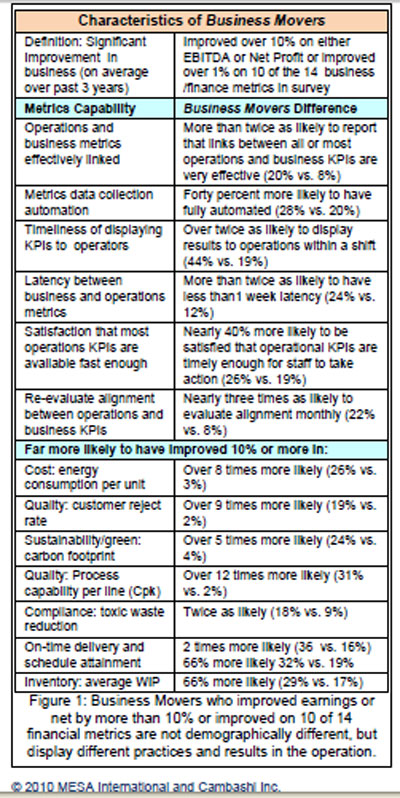
“Business Movers exhibit better improvements in their operations than Others, and they have more timely and rigorous systems for operations performance metrics. They are also more likely to use a wide array of software,” the report states (see table below.)
The survey asked for responses regarding performance across some 26 different metrics – quite a large number - yet the report says the majority of respondents actually tracked all 26 of these measures.
Of the 26 metrics, the survey found that the greatest level of improvement from the 2006 study results came in these six areas of performance:
- Scrap work as a percent of sales
- On-time delivery to customer request
- Manufacturing cycle time
- Average days total inventory
- Batch/lot/unit right the first time
- Overall equipment effectiveness (OEE)
In looking at the overall data, the report notes what it calls some obvious correlations, such as the fact that manufacturers most able to execute initial production schedules as planned were also the most likely to the most likely to meet customer delivery commitments.
However, the “data mining” the survey responses also found some not so obvious correlations, listed below by different manufacturing types:
- Continuous: Reducing energy consumption correlates strongly to improved cash-to-cash cycle time. Sustainability can be very business-friendly: leading manufacturers use automation and analysis to reduce energy consumption. Many of the ways that companies reduce energy consumption have to do with tuning processes for better first-pass yields, which can free up cash in process speed and materials.
- Continuous: Average days of total inventory correlates strongly to improvements in productivity in value-add per employee. Clearly, tying up working capital in inventory hurts performance on business metrics such as productivity.
- Batch: Improvements in supplier quality correlate exactly to improvements in cash-to-cash cycle times. As companies have discovered, materials make the difference and diligence in supplier management pays off.
- Packaged Goods Mixed Mode: Improvements in forecast accuracy correlate strongly to shorter manufacturing cycle times. Clearly, companies that forecast better can execute more effectively in production, and those with shorter cycle times may also have an advantage in producing closer to the actual time of demand.
- Discrete: Data quality correlates strongly to on-time delivery. Since many discrete industry shipments include product data such as a complete genealogy about materials used and the origin of every part and sub-assembly, poor data can delay shipments.
Data Capture and Metrics
Of course, the ability to calculate and use performance metrics is dependent on the ability to capture shop floor data – increasingly in real time.
“Movers are much more likely to display performance results or operational KPIs to the data creators and those managing the operations within a shift or in real-time,” the report notes.
Not surprisingly, the data found that Movers were much more likely to employ auto ID technologies (bar codes, RFID) versus the more manual data collection approaches (key entry, paper) of the “Others.” Movers also make the metrics data available to managers and other personnel with much less latency than the Others group. However, even two-thirds of the Movers would like to see less time between when the data is captured and when it is becomes available
(Manufacturing Article - Continued Below)
|